Above the Green Line -01
  • Market Insights
        • Commentary
          • Daily
          • Weekly
        • BUY / SELL SIGNALS
          • Trade Posts
          • Recent Trade Alerts
          • Recent Day Trades
        • BLOGROLL
          • Dividend Growth Blog
          • ETF Sector Blog
          • Dow Dogs
          • TPOW Blog
  • Strategies
        • SWING TRADING
          • Current Positions
          • Watchlists
          • Closed Positions
          • Candidates - TOP 100
          • Specialty Stocks
        • WEEKLY STOCK PICK
          • TPOW Charts
          • TPOW Performance
          • TPOW Strategy Guide
          • TPOW Performance Dashboard
          • Why Weekly Trading Works
        • DAY TRADING
          • Watch List
        • ATGL DASHBOARD
        • ETF STRATEGIES
          • ETF Sector Rotation
          • ETF Sector Portfolio
        • DIVIDEND GROWTH
          • Dividend Growth Portfolio
          • Dividend Calendar
        • DOGS OF THE DOW
          • Dogs of the Dow Portfolio
          • DOW 5 Portfolio
  • Markets
        • US MARKET
          • Commodities
          • Energy
          • Precious Metals
          • Volatility
        • GLOBAL MARKETS
          • Market Indices
          • Economic Calendar
          • FOREX Heat Map
          • FOREX Cross Rates
          • Crypto Currency Market
  • Investing
    • Discord Community
    • Dashboard
  • Resources
        • INVESTING GUIDES
          • Dividend Growth Guide
          • Investment Strategy Framework
          • ETF Investing Handbook
          • Stock Trading Handbook
        • ARTICLES
          • Dividend Growth Model Articles
          • ETF Articles
          • Investment Strategies Articles
          • Market and Economic Insights
          • Stock Trade Articles
          • Stock Reviews
        • TOOLS
          • Stock Scanners
          • Charting Software
          • Brokerage Firms
          • Stocks We Review
        • STOCK CHARTS
          • Key Components
          • Reading Charts
          • Drawing Stock Charts
          • Identifying Trends
  • About
    • Contact Us
    • How to Win
    • #1 At Stockcharts
    • Disclaimer
    • FAQ
  • Log In
  • Subscribe

Trade Signals

Above the Green Line presents both daily and weekly posts to its members highlighting Investment News and Trade alerts.

October 2, 2019

Money Wave Alert! Oct 2, 2019

DIA Chart

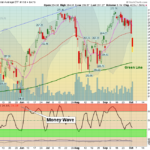
  Markets  were down again today after the S&P 500 Index closed below the Red Line (50-day avg.) yesterday and then sold off more today. Now Support is the Green Line at 2852. The Tech stocks have been under a lot of pressure, and are … [Read more...]

October 1, 2019

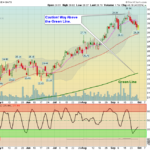
Money Wave Alert! Oct 1, 2019

  Markets  were down today after the S&P 500 Index went slightly above the Pink Line (10-day avg.) and then sold off. Closing above 2981 on the S&P 500 should bring in more Buying. The Tech stocks have been under a lot of pressure, … [Read more...]

September 30, 2019

Money Wave Alert! Sep 30, 2019

ATUS Chart

  Markets  were up today as the S&P 500 Index is trying again to get up above the Pink Line (10-day avg.) Closing above 2987 on the S&P 500 should bring in more Buying. The Tech stocks have been under a lot of pressure, and some are … [Read more...]

September 27, 2019

Money Wave Alert! Sep 27, 2019

SPX Chart

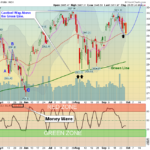
  Markets  were down today on lower Volume as the S&P 500 Index failed again to get up above the Pink Line (10-day avg.) this morning and bring in more Buying. Now the S&P 500 needs to hold at the Red Line (50-day avg.) around 2952. … [Read more...]

September 26, 2019

Money Wave Alert! Sep 26, 2019

SPX 60 Chart

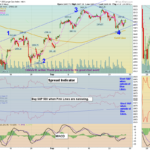
  Markets  were down slightly today after rallying back up from a low this morning. The S&P 500 Index went almost down to the Red Line (50-day avg.) and bounced. The S&P 500 Index could be going up on Wave 5 of the move back up to the … [Read more...]

  • « Previous Page
  • 1
  • …
  • 336
  • 337
  • 338
  • 339
  • 340
  • …
  • 495
  • Next Page »

Subscribe to Our Newsletter

AGL Logo

Get our eBook Now!

Candlestick - A Swing Traders Friend

We don’t spam! Read our privacy policy for more info.

You’ve been successfully subscribed to our newsletter!

Voted #1 at Stock Charts

SH Chart
Inverse S&P 500 Fund (SH) will have a Money Wave Buy today.

Help Us Help Animals

Help Us Help Animals

Recent Comments

  • ATGL Weekly Money Flow - 2026-03-08 on ATGL Top Pick of the Week! Feb 22, 2026
  • XBI ETF Explained: Is This Biotech Fund a Smart Buy in 2026? on What Is an Expense Ratio and What Would Be a Good One?
  • XBI ETF Explained: Is This Biotech Fund a Smart Buy in 2026? on What Are Sector ETFs and How Do You Invest in Them?
  • XBI ETF Explained: Is This Biotech Fund a Smart Buy in 2026? on ETF vs Index Fund Comparison Guide for Smarter Investing
  • How to Use Net Present Value (NPV) for Dividend Stocks on How To Analyze Stocks With the Dividend Discount Model

Become a Green Liner!

Help me make more Money in the Stock Market.

ON ATGL

  • DashBoard
  • Weekly Commentary
  • Daily Buy / Sell Signals
  • Day Trade Setup
  • Trading Rooms

Design & Develop By Pixelvect

STRATEGIES

  • Swing Trading
  • ATGL Pick of the Week
  • Dividend Growth
  • ETF Sector Rotation
  • Dogs of the Dow

HELP

  • ATGL Trading Rules
  • FAQ
  • Account Maintenance
  • Contact US
  • Join

FOLLOW US

Instagram Linkedin Twitter Facebook

© COPYRIGHT 2024 · ABOVETHEGREENLINE.COM · ALL RIGHTS RESERVED · PRIVACY · TERMS · CONTACT · WATCHLIST · CURRENT