
Above the Green Line presents both daily and weekly posts to its members highlighting Investment News and Trade alerts.
Money Wave Alert! Feb 22, 2022
Markets were lower again today on more FEAR Selling, and some of the weaker Stocks have really been trashed. Most of the major Indices are slightly Below the Green Lines, but the S&P 500 Index is still trying to hold. Support is the previous … [Read more...]
Money Wave Alert! Feb 21, 2022
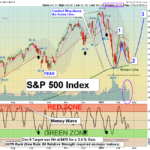
The S&P 500 Chart is still Bullish, but in January it was Way Above the Green Line. From subscriber Masao: "Hi Above Green. Thank you for information. I follow Wave 3 up idea (Click for CHART). However, if goes beyond the last … [Read more...]
Money Wave Alert! Feb 18, 2022
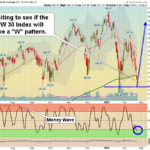
Markets dumped out this morning on more FEAR Selling, but buying came in near the close. Technical Analysts like ATGL are waiting for the Stock Indices to successfully finish re-testing the lows of January ("W" pattern). We should know that when the … [Read more...]
Money Wave Alert! Feb 17, 2022

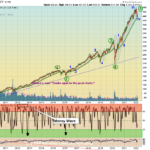
Markets were lower today on more FEAR Selling. Many investors don't believe that the Stock Indices have successfully finished re-testing the lows of January. Apparently Wave 2 down is not over (see DOW chart above). The selling Volume has been low, … [Read more...]
Money Wave Alert! Feb 16, 2022
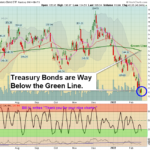
Markets were lower in the morning and then recovered by the end of the day. Commodities are now very over-bought, and T-Bonds are very over-sold, so there should be some surprises soon. It looks like FED tightening in March could slow the Economy … [Read more...]
- « Previous Page
- 1
- …
- 203
- 204
- 205
- 206
- 207
- …
- 483
- Next Page »