By ATGL
Updated March 12, 2026
Knowing how to read and understand different chart patterns is essential in making informed investment decisions. These patterns can highlight important market conditions that often provide astute investors the edge they need to adjust to volatility and market uncertainty.
Charts can provide key insights into a stock’s historical and current performance, reveal trends and patterns, and guide data-driven decisions. The ability to interpret chart patterns is a vital skill that can spotlight investment opportunities, predict price shifts, and help you handle risk.
Technical chart analysis plays an important role in many trading approaches used in the stock market. Investors who want a broader overview of how chart patterns, price action, and trading strategies fit into equity market analysis can explore the Stock Trading Guide, which explains the core principles behind evaluating and trading stocks.
Chart patterns are forms that emerge from a stock’s price evolution or another asset over a span of time. These shapes can reveal information like the direction and strength of a trend, its longevity, and possible points where the trend may reverse or break out.
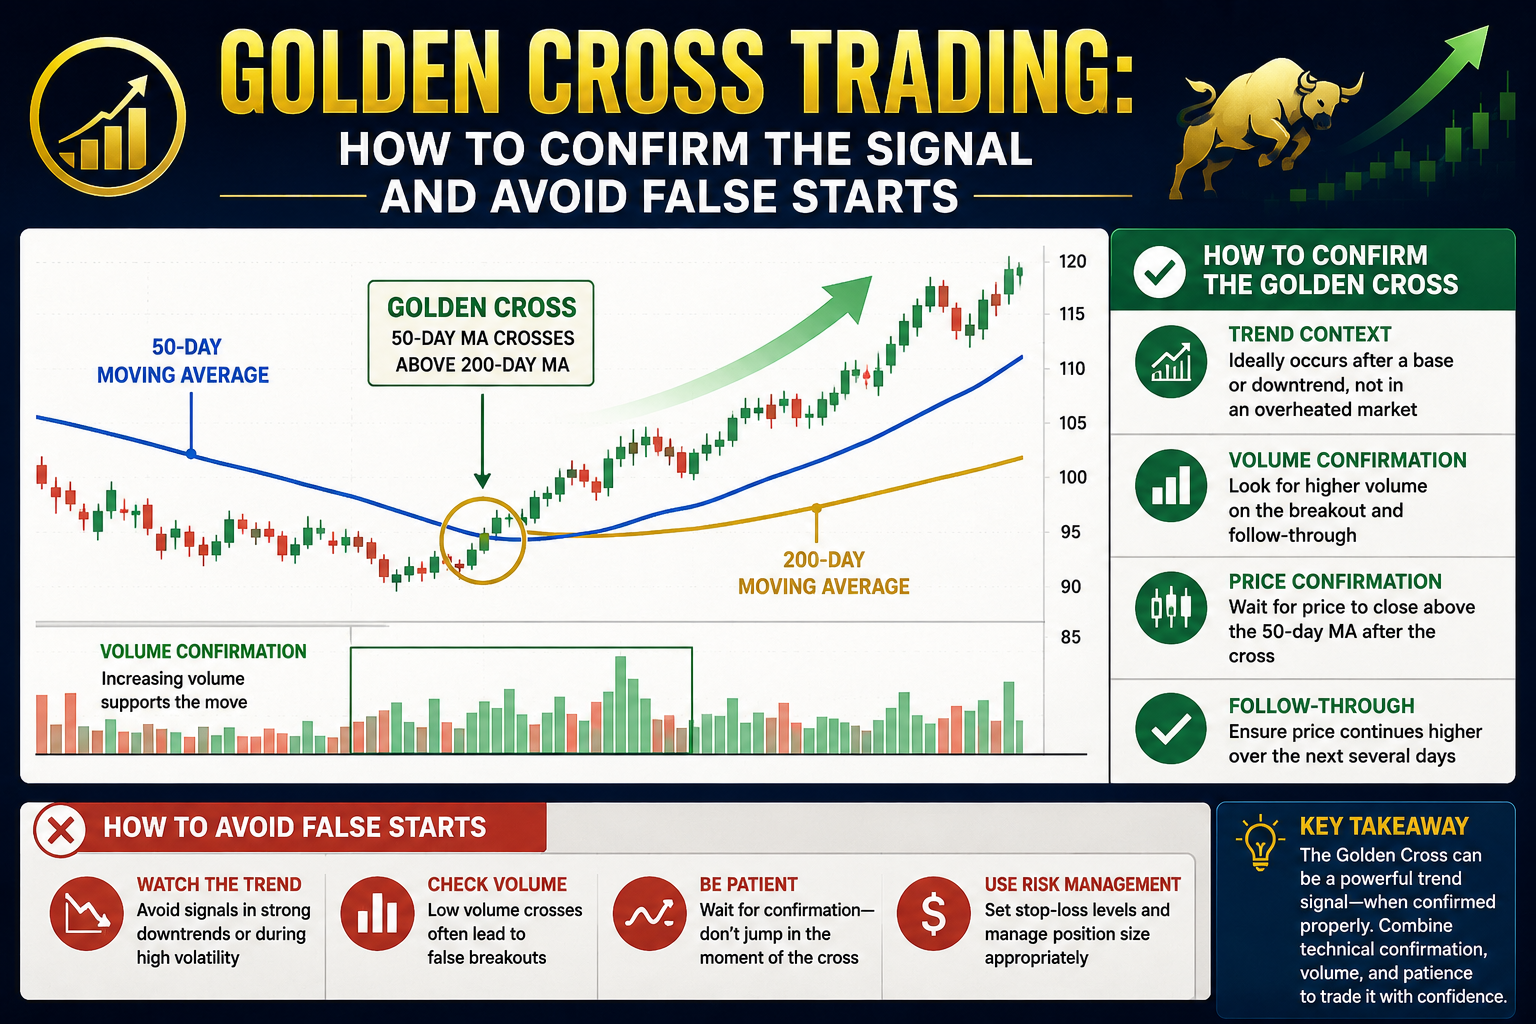
Using multiple tools and indicators — such as volume analysis, support and resistance levels, moving averages, and oscillators — is an important step in corroborating a pattern’s authenticity and importance.
Every pattern carries its own distinct features, regulations, and ramifications for trading. Certain patterns offer more reliable insights, while others may change into different patterns or not fulfill their initial promise.
One such pattern that experienced traders often look for is the fair value gap (FVG). The FVG is a term that describes the variance between a current market price and the fair or hypothetical equilibrium price of an asset or currency, a difference often caused by some inefficiency or imbalance in the market.
The fair value signifies an ideal balanced price that accounts for all available information and analysis. For traders, the FVG serves as an instrument for pinpointing possible trading opportunities through an examination of price behavior.
Incorporating the fair value gap in your trading strategies requires a two-fold understanding: comprehending its implications for the market and your investments, and recognizing the signals for gap trading opportunities. These gaps might symbolize market inefficiencies or seismic shifts in market sentiment that experienced traders can utilize for profitable trades. Moreover, gaps might indicate strong support or resistance levels, providing clues about future price movements.
By accurately reading these signals, you can spot potential entry points for trades, anticipate the direction of price shifts, and better manage risk-to-reward ratios. Keep reading for a comprehensive exploration of this crucial instrument and the vital knowledge you’ll need to shape solid investment choices by leveraging FVG indicators.
What Is a Fair Value Gap (FVG)?
A fair value gap is a term used by price action traders to describe a region on a price chart where the current market price deviates significantly from the fair value, creating a gap between the two figures. When present on candlestick price charts, these gaps can indicate a “liquidity void,” a three-candle sequence with spaces between the low of a previous candle and the high of the neighboring candles (or vice versa).
Candlesticks function as visual displays indicating market price fluctuations within a specific timeframe. These diagrams reveal key points such as opening and closing prices and each trading session’s highest and lowest values, including the trend’s direction and momentum. Transitory patterns that suggest shifts or extensions in trends can also be spotted in candlestick charts.
Put another way, a fair value gap indicator highlights market inefficiencies or a trading imbalance that may be artificially throttling a stock’s price. Fair value gaps appear in triple-candle patterns with a large candle that follows previous candles with a high and low that don’t fully overlap the third, larger candle.
To spot an FVG pattern, look for a substantial candlestick with a body-to-wick ratio of 70%, succeeded by two less sizable candlesticks that don’t intersect with the larger one. The price region between the first and third candlestick’s wicks represents the FVG. The FVG can appear as undervalued or overestimated if the price dips below or escalates above the fair value.
The gaps on price charts in the space between the wicks of these candles indicate the difference between a traded product’s fair and market values. FVGs can often show where and by how much price moves are likely to occur. This indicator of underlying market structure highlights potential trading opportunities and can be a rich source of information for anyone who uses an FVG-based trading strategy.
Top 3 FVG Implications for Investor Decision-Making
Though the underlying causes of FVGs in trading can be complex, their meaning is typically clear, and their influence on an investor’s decision-making process can be invaluable. Identifying an FVG pattern in a price chart can potentially:
1. Identify Potential Profit
The FVG trading approach’s primary advantage is that it helps traders identify areas of potential profit. By observing the trio of candles that reveals the gap, experienced price action traders can forecast future prices and spot profitable opportunities to enter and exit FVG trades. Trading on FVG patterns can lead to bigger profits.
2. Recognize Financial Market Inefficiencies and Manage Risk
The fair value gap is also an excellent tool for spotting inefficiencies in the market and can influence both buy-and-hold and market-timing investment decisions. Rapid price movements that create gaps might represent a shift in market structure or other financial market anomalies, which experienced traders can exploit by trading FVG patterns.
Successfully using FVGs in trading means understanding the fair value gap indicator, which can also be pivotal in risk management. Traders can mitigate potential losses by recognizing resistance levels and anticipating price moves. More experienced traders may also be able to use FVG strategies to inform short-selling investment decisions.
3. Predict Future Price Movements
Experienced traders can predict price changes and find the best times to trade FVG assets. By examining the price action around the gap, traders can glean insights into market sentiment and dynamics and identify areas with a high risk-reward ratio. Traders who master the art of fair value gap trading and value gap analysis can anticipate price reversals or continuations, giving them a competitive edge.
Get Support with Identifying Trading Opportunities
Finding and interpreting FVGs can pose a challenge, especially for novice traders. Don’t let a knowledge gap stop you from leveraging this powerful trading tool. Above the Green Line understands the importance of gap analysis and can provide data and insights to help you benefit from fair value gap trading strategies.
Join the Above the Green Line community today to feel more confident using FVGs as part of your trading strategy. Remember, successful trading is not the product of sheer luck — it comes from a precise understanding of market mechanics and the astute application of trading knowledge.

Related Articles
[pt_view id=”b1ac254g2i”]