Above The Green Line

  • Commentary
    • BUY / SELL SIGNALS
      • Stock Alerts
    • DIVGRO BLOG
    • ETF SECTOR BLOG
    • DOW DOGS BLOG
    • NEWS
    • STOCK IDEAS
  • Strategies
    • SWING TRADING
      • CURRENT POSITIONS
      • WATCHLISTS
      • CLOSED POSITIONS
      • CANDIDATES – TOP 100
      • SPECIALTY STOCKS
    • DAY TRADING
      • Watch List
    • DIVIDEND GROWTH
      • Dividend Growth Portfolio
      • Dividend Calendar
    • DOGS OF THE DOW
      • Dogs of the Dow Portfolio
      • DOW 5 Portfolio
    • ETF SECTOR ROTATION
      • ETF Sector Portfolio
  • Markets
    • US MARKET
      • Commodities
      • Energy
      • Precious Metals
      • Volatility
    • GLOBAL MARKETS
      • MARKET INDICES
      • ECONOMIC CALENDAR
      • FOREX HEAT MAP
      • FOREX CROSS RATES
      • CRYPTOCURRENCY MARKET
    • DASHBOARD
    • IDEAS
  • Investing
    • FORUM
  • Resources
    • ARTICLES
    • WEEKLY STOCK
    • RETIREMENT PLANNING
    • BLOGROLL
    • FAQ
  • About
    • CONTACT US
    • HOW TO WIN
    • #1 AT STOCKCHARTS
  • Log In
  • Subscribe

Correlation Coefficient

Correlation Coefficient

The Correlation Coefficient is a statistical measure of the strength of the relationship between the relative movement of two variables. The correlation statistics is used in both Finance and Investing. There are several types of correlation coefficients with the Pearson correlation (r) being the most common.

KEY TAKEAWAYS

  • Correlation coefficients are used to measure the strength of the relationship between two variables.
  • Pearson correlation is the one most commonly used in statistics. This measures the strength and direction of a linear relationship between two variables.
  • Values always range between -1 (strong negative relationship) and +1 (strong positive relationship). Values at or close to zero imply weak or no linear relationship.
  • Correlation coefficient values less than +0.8 or greater than -0.8 are not considered significant.

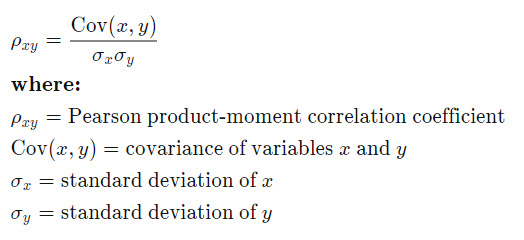
The calculation of the Pearson Correlation is given by the expression below.

Pearson Correlation Coefficient
Pearson Correlation Coefficient formula

Voted #1 at Stock Charts

SH Chart
Inverse S&P 500 Fund (SH) will have a Money Wave Buy today.

Help Us Help Animals

Help Us Help Animals

Recent Comments

  • AbovetheGreenLine on Money Wave Alert! Jan 17, 2023
  • merryme on Money Wave Alert! Jan 17, 2023
  • AbovetheGreenLine on ETF Sector Rotation System Changes
  • Vincent Colombe on ETF Sector Rotation System Changes
  • AbovetheGreenLine on ETF Sector Rotation System Changes

Become a Green Liner!

Help me make more Money in the Stock Market.

Above the Green Line

ON ATGL

  • Weekly Commentary
  • Intraday Buy / Sells
  • Day Trade Setup

STRATEGIES

  • Swing Trading
  • Dividend Growth
  • ETF Sector Rotation
  • Dogs of the Dow

HELP

  • ATGL Trading Rules
  • FAQ
  • Account Maintenance
  • Contact US

© Copyright 2021 · AboveTheGreenLine.com · All Rights Reserved · Privacy · Terms · Contact · WatchList · Current