Above The Green Line

  • Commentary
    • BUY / SELL SIGNALS
      • Stock Alerts
    • DIVGRO BLOG
    • ETF SECTOR BLOG
    • DOW DOGS BLOG
    • NEWS
    • STOCK IDEAS
  • Strategies
    • SWING TRADING
      • CURRENT POSITIONS
      • WATCHLISTS
      • CLOSED POSITIONS
      • CANDIDATES – TOP 100
      • SPECIALTY STOCKS
    • DAY TRADING
      • Watch List
    • DIVIDEND GROWTH
      • Dividend Growth Portfolio
      • Dividend Calendar
    • DOGS OF THE DOW
      • Dogs of the Dow Portfolio
      • DOW 5 Portfolio
    • ETF SECTOR ROTATION
      • ETF Sector Portfolio
  • Markets
    • US MARKET
      • Commodities
      • Energy
      • Precious Metals
      • Volatility
    • GLOBAL MARKETS
      • MARKET INDICES
      • ECONOMIC CALENDAR
      • FOREX HEAT MAP
      • FOREX CROSS RATES
      • CRYPTOCURRENCY MARKET
    • DASHBOARD
    • IDEAS
  • Investing
    • FORUM
  • Resources
    • ARTICLES
    • WEEKLY STOCK
    • RETIREMENT PLANNING
    • BLOGROLL
    • FAQ
  • About
    • CONTACT US
    • HOW TO WIN
    • #1 AT STOCKCHARTS
  • Log In
  • Subscribe

Commodity Channel Index

Commodity Channel Index

The Commodity Channel Index​ (CCI), developed by Donald Lambert, is a momentum-based oscillator used to help determine when an investment vehicle is reaching a condition of being overbought or oversold.

KEY TAKEAWAYS

  • The CCI measures the difference between the current price and the historical average price.
  • When the CCI is above zero it indicates the price is above the historic average. When CCI is below zero, the price is below the hsitoric average.
  • High readings of 100 or above, for example, indicate the price is well above the historic average and the trend has been strong to the upside.
  • Low readings below -100, for example, indicate the price is well below the historic average and the trend has been strong to the downside.
  • Going from negative or near-zero readings to +100 can be used as a signal to watch for an emerging uptrend.
  • Going from positive or near-zero readings to -100 may indicate an emerging downtrend.
  • CCI is an unbounded indicator meaning it can go higher or lower indefinitely. For this reason, overbought and oversold levels are typically determined for each individual asset by looking at historical extreme CCI levels where the price reversed from.

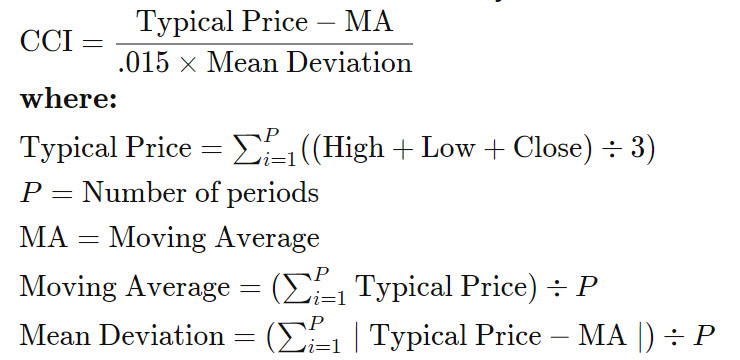
The formula for calculating the Commodity Channel Index (CCI) is shown below.

CCI Formula
Commodity Channel Index Formula

Limitations of Using the Commodity Channel Index (CCI)

While often used to spot overbought and oversold conditions, the CCI is highly subjective in this regard. The indicator is unbound and therefore, prior overbought and oversold levels may have little impact in the future. The indicator is also lagging, which means at times it will provide poor signals.

Voted #1 at Stock Charts

SH Chart
Inverse S&P 500 Fund (SH) will have a Money Wave Buy today.

Help Us Help Animals

Help Us Help Animals

Recent Comments

  • AbovetheGreenLine on Target was Hit on IVERIC Bio for a 13.4% Gain.
  • Gustavo Covacevich on Target was Hit on IVERIC Bio for a 13.4% Gain.
  • AbovetheGreenLine on Money Wave Alert! Jan 31, 2023
  • tri nguyen on Money Wave Alert! Jan 31, 2023
  • AbovetheGreenLine on Money Wave Alert! Jan 17, 2023

Become a Green Liner!

Help me make more Money in the Stock Market.

Above the Green Line

ON ATGL

  • Weekly Commentary
  • Intraday Buy / Sells
  • Day Trade Setup

STRATEGIES

  • Swing Trading
  • Dividend Growth
  • ETF Sector Rotation
  • Dogs of the Dow

HELP

  • ATGL Trading Rules
  • FAQ
  • Account Maintenance
  • Contact US

© Copyright 2021 · AboveTheGreenLine.com · All Rights Reserved · Privacy · Terms · Contact · WatchList · Current