Above the Green Line -01
  • Market Insights
        • Commentary
          • Daily
          • Weekly
        • BUY / SELL SIGNALS
          • Trade Posts
          • Recent Trade Alerts
          • Recent Day Trades
        • BLOGROLL
          • Dividend Growth Blog
          • ETF Sector Blog
          • Dow Dogs
          • TPOW Blog
  • Strategies
        • SWING TRADING
          • Current Positions
          • Watchlists
          • Closed Positions
          • Candidates - TOP 100
          • Specialty Stocks
        • WEEKLY STOCK PICK
          • TPOW Charts
          • TPOW Performance
          • TPOW Strategy Guide
          • TPOW Performance Dashboard
        • DAY TRADING
          • Watch List
        • ATGL DASHBOARD
        • ETF STRATEGIES
          • ETF Sector Rotation
          • ETF Sector Portfolio
        • DIVIDEND GROWTH
          • Dividend Growth Portfolio
          • Dividend Calendar
        • DOGS OF THE DOW
          • Dogs of the Dow Portfolio
          • DOW 5 Portfolio
  • Markets
        • US MARKET
          • Commodities
          • Energy
          • Precious Metals
          • Volatility
        • GLOBAL MARKETS
          • Market Indices
          • Economic Calendar
          • FOREX Heat Map
          • FOREX Cross Rates
          • Crypto Currency Market
  • Investing
    • Discord Community
    • Dashboard
  • Resources
        • ARTICLES
          • Dividend Growth Model Articles
          • ETF Articles
          • Investment Strategies Articles
          • Market and Economic Insights
          • Stock Trade Articles
          • Stock Reviews
        • TOOLS
          • Stock Scanners
          • Charting Software
          • Brokerage Firms
        • STOCK CHARTS
          • Key Components
          • Reading Charts
          • Drawing Stock Charts
          • Identifying Trends
        • RETIREMENT PLANNING
  • About
    • Contact Us
    • How to Win
    • #1 At Stockcharts
    • Disclaimer
    • FAQ
  • Log In
  • Subscribe

January 15, 2019

Money Wave Alert! Jan 15, 2019

QQQ Chart

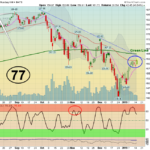
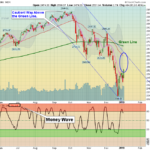
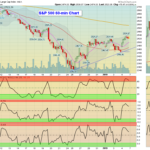
  Markets  were up today as the Indices are back up to the Red Lines (50-day avgs.)  The S&P 500 Red Line is at 2617, and today's High was 2613. The Indices could go back down to re-test the Lows if they Fail here, so we are slowly … [Read more...]

January 14, 2019

Money Wave Alert! Jan 14, 2019

UNG Chart

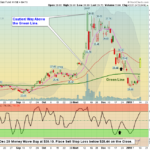
  More of the same... A very slow, tight range day in the Markets. Markets  were mixed again today as the Indices are back up near the Red Lines (50-day avgs.) and they could go back down to re-test the Lows if they Fail here.  LULU was … [Read more...]

January 13, 2019

Green Line Weekly Jan 13, 2019

FEAR Chart

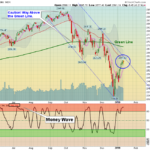
  01/13/2019:  Markets  were up again this week as the Indices rallied up towards their Red Lines (50-day avgs.) Many of the weaker Investments that fell Way Below the Green Lines have popped up quite a bit, but only 37% of the S&P 500 … [Read more...]

January 11, 2019

Money Wave Alert! Jan 11, 2019

SPX Chart

  Markets  were mixed again today as the Indices are back up near the Red Lines (50-day avgs.) and they could go back down to re-test the Lows if they Fail here. That would be normal after a Steep decline like we saw in December. We have … [Read more...]

January 10, 2019

Money Wave Alert! Jan 10, 2019

CGC Chart

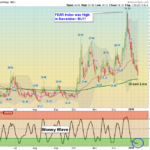
  Markets  were mixed today as the Indices are back up near the Red Lines (50-day avgs.) and  they could go back down to re-test the Lows if they Fail here. That would be normal after a Steep decline like we saw in December. The FEAR has … [Read more...]

January 9, 2019

Money Wave Alert! Jan 9, 2019

QQQ Chart

  Markets  were higher again today as the FEAR has subsided and Buyers are hoping that the Market has bottomed. Now they are Buying Pot Stocks again like CGC (up 12% today) so you know Tammy feels more confident. We will see if the Indices … [Read more...]

January 8, 2019

Money Wave Alert! Jan 8, 2019

SH Chart

  The Markets  were higher again today as longer term Buyers are hoping for a Market bottom. Because the steep decline of the Markets in December, there is a high probability that the Indices will fail near the Red Lines (50-day avgs.) and go … [Read more...]

January 7, 2019

Money Wave Alert! Jan 7, 2019

DIA Chart

  The Markets  were higher today after Friday's big rally, but closed weaker.  There was some better buying on the weaker stocks, as the bargain hunters were feeling more confident. We have RAISED the Sell Stop Losses on many positions, as … [Read more...]

January 6, 2019

Green Line Weekly Jan 6, 2019

SPX Daily

  01/06/2019:  Markets  were up again this week as the Indices rallied up towards their Red Lines (50-day avgs.) Slowly the Investor Sentiment should change to a more positive view as Buyers come back in from an Over-Sold condition.  … [Read more...]

January 4, 2019

Money Wave Alert! Jan 4, 2019

SPX 60-min

  The Markets  went down and down last quarter, warning the FED not to RAISE RATES anymore. But the FED did not listen and Raised Rates more. So the Markets continued down and finally the FED caved in today (after Tammy sold out near the … [Read more...]

  • « Previous Page
  • 1
  • …
  • 357
  • 358
  • 359
  • 360
  • 361
  • …
  • 363
  • Next Page »

Subscribe to Our Newsletter

AGL Logo

Get our eBook Now!

Candlestick - A Swing Traders Friend

We don’t spam! Read our privacy policy for more info.

You’ve been successfully subscribed to our newsletter!

Voted #1 at Stock Charts

SH Chart
Inverse S&P 500 Fund (SH) will have a Money Wave Buy today.

Help Us Help Animals

Help Us Help Animals

Recent Comments

  • Want to Protect Your Capital? Start With Better Position Sizing on Risk Management in Trading: Tools and Techniques
  • Want to Protect Your Capital? Start With Better Position Sizing on Swing Trading Risk Management: Tips To Safeguard Your Profits
  • Price Action Trading Strategies That Work in Any Market on What Is a Death Cross in Stocks? A Bearish Market Signal
  • ATGL Weekly Money Flow - 2025-07-13 on AGTL Top Pick of the Week! May 11, 2025
  • Market Breadth Indicators: A Trader’s Guide to Early Trend Detection on Backtesting: Definition and How a Trading Strategy Backtest Works

Become a Green Liner!

Help me make more Money in the Stock Market.

ON ATGL

  • DashBoard
  • Weekly Commentary
  • Daily Buy / Sell Signals
  • Day Trade Setup
  • Trading Rooms

Design & Develop By Pixelvect

STRATEGIES

  • Swing Trading
  • ATGL Pick of the Week
  • Dividend Growth
  • ETF Sector Rotation
  • Dogs of the Dow

HELP

  • ATGL Trading Rules
  • FAQ
  • Account Maintenance
  • Contact US
  • Join

FOLLOW US

Instagram Linkedin Twitter Facebook

© COPYRIGHT 2024 · ABOVETHEGREENLINE.COM · ALL RIGHTS RESERVED · PRIVACY · TERMS · CONTACT · WATCHLIST · CURRENT