Above the Green Line -01
  • Market Insights
        • Commentary
          • Daily
          • Weekly
        • BUY / SELL SIGNALS
          • Trade Posts
          • Recent Trade Alerts
          • Recent Day Trades
        • BLOGROLL
          • Dividend Growth Blog
          • ETF Sector Blog
          • Dow Dogs
          • TPOW Blog
  • Strategies
        • SWING TRADING
          • Current Positions
          • Watchlists
          • Closed Positions
          • Candidates - TOP 100
          • Specialty Stocks
        • WEEKLY STOCK PICK
          • TPOW Charts
          • TPOW Performance
          • TPOW Strategy Guide
          • TPOW Performance Dashboard
        • DAY TRADING
          • Watch List
        • ATGL DASHBOARD
        • ETF STRATEGIES
          • ETF Sector Rotation
          • ETF Sector Portfolio
        • DIVIDEND GROWTH
          • Dividend Growth Portfolio
          • Dividend Calendar
        • DOGS OF THE DOW
          • Dogs of the Dow Portfolio
          • DOW 5 Portfolio
  • Markets
        • US MARKET
          • Commodities
          • Energy
          • Precious Metals
          • Volatility
        • GLOBAL MARKETS
          • Market Indices
          • Economic Calendar
          • FOREX Heat Map
          • FOREX Cross Rates
          • Crypto Currency Market
  • Investing
    • Discord Community
    • Dashboard
  • Resources
        • ARTICLES
          • Dividend Growth Model Articles
          • ETF Articles
          • Investment Strategies Articles
          • Market and Economic Insights
          • Stock Trade Articles
          • Stock Reviews
        • TOOLS
          • Stock Scanners
          • Charting Software
          • Brokerage Firms
        • STOCK CHARTS
          • Key Components
          • Reading Charts
          • Drawing Stock Charts
          • Identifying Trends
        • RETIREMENT PLANNING
  • About
    • Contact Us
    • How to Win
    • #1 At Stockcharts
    • Disclaimer
    • FAQ
  • Log In
  • Subscribe

July 18, 2019

Money Wave Alert! Jul 18, 2019

QQQ Chart

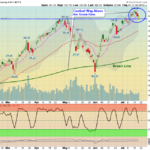
  Markets  were mixed today after recovering from a drop this morning on low Volume.  The S&P 500 Index closed below the Pink Line (10-day avg.) yesterday around 2994 and did not DUMP, so Buyers still have more Money. Maybe a re-test of … [Read more...]

July 17, 2019

Money Wave Alert! Jul 17, 2019

SPY Chart

  Markets  were down slightly on more low Volume.  The S&P 500 Index is weaker and might Close below the Pink Line (10-day avg.) around 2996 to create a Short Term Sell Signal. Short Term traders might want to raise some Cash and WAIT for … [Read more...]

July 16, 2019

Money Wave Alert! Jul 16, 2019

WHSH Chart

  Markets  were mixed again today on very low Volume.  The S&P 500 Index is over bought and needs to bounce off the Pink Line (10-day avg.) around 2994 to avoid a Short Term Sell Signal. Short Term traders might want to raise some Cash … [Read more...]

July 15, 2019

Money Wave Alert! Jul 15, 2019

SPX Chart

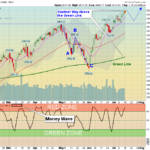
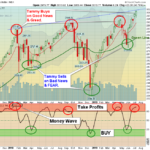
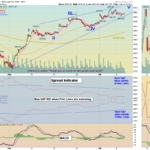
  Markets  were mixed today on very low Volume.  The S&P 500 Index is over bought and in the Red Zone, and might pull back down to re-test the 2960 Support in a few days (see Chart above) before rallying more. Short Term traders might … [Read more...]

July 14, 2019

Green Line Weekly Jul 14, 2019

SPX Weekly Chart

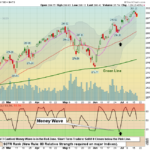
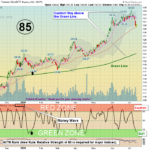
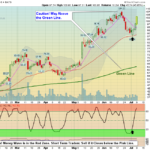
  07/14/2019:  Markets were up again for the week, after Investors received more Good News about FED Printing (the FED should cut Interest Rates 1/4 point on July 31.) The S&P 500 Index and DOW INDEX were able to make new Highs, but are … [Read more...]

July 12, 2019

Money Wave Alert! Jul 12, 2019

TLT Chart

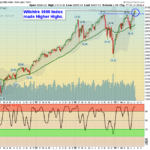
  Markets  were higher today as the DOW Index surged up more.  The S&P 500 Index got above the recent High of 2996, and is now at 3012 for the rally to continue. Markets are currently over-bought so Short Term traders might want to raise … [Read more...]

July 11, 2019

Money Wave Alert! Jul 11, 2019

OKTA Chart

  TWITTER has been down since 2:50 EDT today Markets  were mixed today but the DOW Index was up masking some of the profit taking that is going on.  The S&P 500 Index has still not been able to exceed the recent High of 2996, maybe … [Read more...]

July 10, 2019

Money Wave Alert! Jul 10, 2019

AMD Chart

  Markets  were up today on Good News from the FED about more Printing.  The S&P 500 Index was able to exceed the recent High of 2996, but needs to Close above there for this rally to continue. Markets are currently over-bought so Short … [Read more...]

July 9, 2019

Money Wave Alert! Jul 9, 2019

SPX Hourly Chart

  Markets  were mixed today after the S&P 500 Index went down near the Pink Line (10-day avg.) and bounced. Now it needs to exceed the recent High of 2996 for this rally to continue. Markets are currently over-bought so Short Term traders … [Read more...]

July 8, 2019

Money Wave Alert! Jul 8, 2019

ROKU Chart

  Markets  were down today on normal profit taking from last week's rally. The S&P 500 Index is over-bought and in the Red Zone (probably too high to Buy for the Short Term). Bonds are back up as the Markets dropped, and are Way Above … [Read more...]

  • « Previous Page
  • 1
  • …
  • 342
  • 343
  • 344
  • 345
  • 346
  • …
  • 363
  • Next Page »

Subscribe to Our Newsletter

AGL Logo

Get our eBook Now!

Candlestick - A Swing Traders Friend

We don’t spam! Read our privacy policy for more info.

You’ve been successfully subscribed to our newsletter!

Voted #1 at Stock Charts

SH Chart
Inverse S&P 500 Fund (SH) will have a Money Wave Buy today.

Help Us Help Animals

Help Us Help Animals

Recent Comments

  • Breakout Trading Strategies That Can Boost Your Gains on 7 Day Trading Strategies for New Investors
  • What the Descending Staircase Pattern Tells You About the Market on Bull vs. Bear Market: An Investor’s Guide to Market Phases
  • Want to Protect Your Capital? Start With Better Position Sizing on Risk Management in Trading: Tools and Techniques
  • Want to Protect Your Capital? Start With Better Position Sizing on Swing Trading Risk Management: Tips To Safeguard Your Profits
  • Price Action Trading Strategies That Work in Any Market on What Is a Death Cross in Stocks? A Bearish Market Signal

Become a Green Liner!

Help me make more Money in the Stock Market.

ON ATGL

  • DashBoard
  • Weekly Commentary
  • Daily Buy / Sell Signals
  • Day Trade Setup
  • Trading Rooms

Design & Develop By Pixelvect

STRATEGIES

  • Swing Trading
  • ATGL Pick of the Week
  • Dividend Growth
  • ETF Sector Rotation
  • Dogs of the Dow

HELP

  • ATGL Trading Rules
  • FAQ
  • Account Maintenance
  • Contact US
  • Join

FOLLOW US

Instagram Linkedin Twitter Facebook

© COPYRIGHT 2024 · ABOVETHEGREENLINE.COM · ALL RIGHTS RESERVED · PRIVACY · TERMS · CONTACT · WATCHLIST · CURRENT