Above the Green Line -01
  • Market Insights
        • Commentary
          • Daily
          • Weekly
        • BUY / SELL SIGNALS
          • Trade Posts
          • Recent Trade Alerts
          • Recent Day Trades
        • BLOGROLL
          • Dividend Growth Blog
          • ETF Sector Blog
          • Dow Dogs
          • TPOW Blog
  • Strategies
        • SWING TRADING
          • Current Positions
          • Watchlists
          • Closed Positions
          • Candidates - TOP 100
          • Specialty Stocks
        • WEEKLY STOCK PICK
          • TPOW Charts
          • TPOW Performance
          • TPOW Strategy Guide
          • TPOW Performance Dashboard
        • DAY TRADING
          • Watch List
        • ATGL DASHBOARD
        • ETF STRATEGIES
          • ETF Sector Rotation
          • ETF Sector Portfolio
        • DIVIDEND GROWTH
          • Dividend Growth Portfolio
          • Dividend Calendar
        • DOGS OF THE DOW
          • Dogs of the Dow Portfolio
          • DOW 5 Portfolio
  • Markets
        • US MARKET
          • Commodities
          • Energy
          • Precious Metals
          • Volatility
        • GLOBAL MARKETS
          • Market Indices
          • Economic Calendar
          • FOREX Heat Map
          • FOREX Cross Rates
          • Crypto Currency Market
  • Investing
    • Discord Community
    • Dashboard
  • Resources
        • ARTICLES
          • Dividend Growth Model Articles
          • ETF Articles
          • Investment Strategies Articles
          • Market and Economic Insights
          • Stock Trade Articles
          • Stock Reviews
        • TOOLS
          • Stock Scanners
          • Charting Software
          • Brokerage Firms
        • STOCK CHARTS
          • Key Components
          • Reading Charts
          • Drawing Stock Charts
          • Identifying Trends
        • RETIREMENT PLANNING
  • About
    • Contact Us
    • How to Win
    • #1 At Stockcharts
    • Disclaimer
    • FAQ
  • Log In
  • Subscribe

July 17, 2020

Money Wave Alert! Jul 17, 2020

NIO Chart

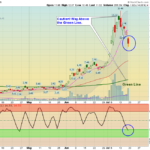
Markets were mixed today, as the Strongest Leaders are not quite back down in the Green Zones. The Volume is very Low as many cannot decide what to do. The S&P 500 Index needs to Close above 3238 to remain Bullish. Please WAIT for the Leaders … [Read more...]

July 16, 2020

Money Wave Alert! Jul 16, 2020

SPX Chart

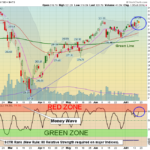
Markets were down today, but not enough to get many Leaders back down in the Green Zones. The Volume is very Low as many cannot decide what to do. The S&P 500 Index needs to Close above 3238 to remain Bullish. Many of the Strongest Leaders … [Read more...]

Closed Medium Term Results

Closed Medium Term Results Below is our list of Closed Medium Term Results with links to "Real-Time" charts.   We use the Closing Prices on Buys & Sells, which hurts our performance numbers. To access Current Closed Positions for the … [Read more...]

Closed Long Term Results

Closed Long Term Results Below is our list of Closed Long Term Results with links to "Real-Time" charts.   We use the Closing Prices on Buys & Sells, which hurts our performance numbers. To access Current Closed Positions for the other … [Read more...]

July 15, 2020

Money Wave Alert! Jul 15, 2020

DIA Chart

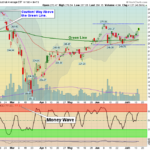
Markets gapped up today as some Big DOW Stocks had better than expected Earnings, and the DOW Index has been lagging the Stronger Indices. The S&P 500 Index went back up to re-test yesterday's High, but was not able to make progress. Many of … [Read more...]

July 14, 2020

Money Wave Alert! Jul 14, 2020

QQQ Chart

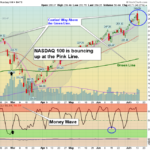
Markets were up today after the Large Cap Techs and Leaders got hit pretty hard with Selling yesterday. The Strongest Investments are bouncing at their Pink Lines (10-day avgs.) to avoid a Short Term Sell Signal. There is still some late chaser money … [Read more...]

July 13, 2020

Money Wave Alert! Jul 13, 2020

SPX 60 Chart

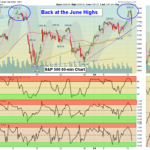
Markets were mixed today after the Large Cap Techs continued to blow out in the morning. The Strongest Leaders are very extended for the Short Term.  The S&P 500 Index made it up to the early June Highs of 3233, and then back off. The S&P 500 … [Read more...]

July 12, 2020

Green Line Weekly Jul 12, 2020

Green Line Weekly

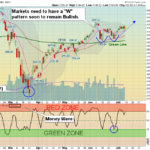
07/12/2020 Markets were up again for the week as the Indices are trying to get back up to the early June Highs. The S&P 500 Index is doing a "W" pattern off the Red Line (50-day avg.) and needs to exceed the June Highs for this rally up to … [Read more...]

July 10, 2020

Money Wave Alert! Jul 10, 2020

SPX Chart

Markets were up today after yesterday's decline. Some of the Large Cap Techs had some mild profit taking. The Strongest Leaders are very extended for the Short Term.  The S&P 500 Index needs to exceed the early June Highs of 3233 for this rally … [Read more...]

July 9, 2020

Money Wave Alert! Jul 9, 2020

QQQ Chart

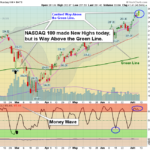
Markets were mixed today, but the Large Cap Tech stretched higher. The Strongest Leaders are very extended for the Short Term. The NASDAQ 100 Fund and Semiconductors were able to make New Highs today with the weak US Dollar. The S&P 500 Index … [Read more...]

  • « Previous Page
  • 1
  • …
  • 311
  • 312
  • 313
  • 314
  • 315
  • …
  • 364
  • Next Page »

Subscribe to Our Newsletter

AGL Logo

Get our eBook Now!

Candlestick - A Swing Traders Friend

We don’t spam! Read our privacy policy for more info.

You’ve been successfully subscribed to our newsletter!

Voted #1 at Stock Charts

SH Chart
Inverse S&P 500 Fund (SH) will have a Money Wave Buy today.

Help Us Help Animals

Help Us Help Animals

Recent Comments

  • Breakout Trading Strategies That Can Boost Your Gains on 7 Day Trading Strategies for New Investors
  • What the Descending Staircase Pattern Tells You About the Market on Bull vs. Bear Market: An Investor’s Guide to Market Phases
  • Want to Protect Your Capital? Start With Better Position Sizing on Risk Management in Trading: Tools and Techniques
  • Want to Protect Your Capital? Start With Better Position Sizing on Swing Trading Risk Management: Tips To Safeguard Your Profits
  • Price Action Trading Strategies That Work in Any Market on What Is a Death Cross in Stocks? A Bearish Market Signal

Become a Green Liner!

Help me make more Money in the Stock Market.

ON ATGL

  • DashBoard
  • Weekly Commentary
  • Daily Buy / Sell Signals
  • Day Trade Setup
  • Trading Rooms

Design & Develop By Pixelvect

STRATEGIES

  • Swing Trading
  • ATGL Pick of the Week
  • Dividend Growth
  • ETF Sector Rotation
  • Dogs of the Dow

HELP

  • ATGL Trading Rules
  • FAQ
  • Account Maintenance
  • Contact US
  • Join

FOLLOW US

Instagram Linkedin Twitter Facebook

© COPYRIGHT 2024 · ABOVETHEGREENLINE.COM · ALL RIGHTS RESERVED · PRIVACY · TERMS · CONTACT · WATCHLIST · CURRENT