Above the Green Line -01
  • Market Insights
        • Commentary
          • Daily
          • Weekly
        • BUY / SELL SIGNALS
          • Trade Posts
          • Recent Trade Alerts
          • Recent Day Trades
        • BLOGROLL
          • Dividend Growth Blog
          • ETF Sector Blog
          • Dow Dogs
          • TPOW Blog
  • Strategies
        • SWING TRADING
          • Current Positions
          • Watchlists
          • Closed Positions
          • Candidates - TOP 100
          • Specialty Stocks
        • WEEKLY STOCK PICK
          • TPOW Charts
          • TPOW Performance
          • TPOW Strategy Guide
          • TPOW Performance Dashboard
        • DAY TRADING
          • Watch List
        • ATGL DASHBOARD
        • ETF STRATEGIES
          • ETF Sector Rotation
          • ETF Sector Portfolio
        • DIVIDEND GROWTH
          • Dividend Growth Portfolio
          • Dividend Calendar
        • DOGS OF THE DOW
          • Dogs of the Dow Portfolio
          • DOW 5 Portfolio
  • Markets
        • US MARKET
          • Commodities
          • Energy
          • Precious Metals
          • Volatility
        • GLOBAL MARKETS
          • Market Indices
          • Economic Calendar
          • FOREX Heat Map
          • FOREX Cross Rates
          • Crypto Currency Market
  • Investing
    • Discord Community
    • Dashboard
  • Resources
        • ARTICLES
          • Dividend Growth Model Articles
          • ETF Articles
          • Investment Strategies Articles
          • Market and Economic Insights
          • Stock Trade Articles
          • Stock Reviews
        • TOOLS
          • Stock Scanners
          • Charting Software
          • Brokerage Firms
        • STOCK CHARTS
          • Key Components
          • Reading Charts
          • Drawing Stock Charts
          • Identifying Trends
        • RETIREMENT PLANNING
  • About
    • Contact Us
    • How to Win
    • #1 At Stockcharts
    • Disclaimer
    • FAQ
  • Log In
  • Subscribe

October 7, 2021

Money Wave Alert! Oct 7, 2021

CEI Chart

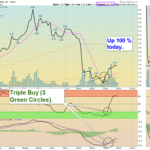
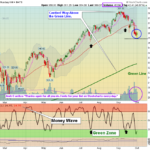
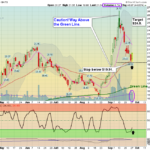
Markets were higher today as the S&P 500 Index is trying to get back above the Red Line (50-day avg.) of 4404. The S&P 500 Index and could have  finished with an A-B-C Correction. Then the S&P 500 could go back up to re-test the … [Read more...]

October 6, 2021

Money Wave Alert! Oct 6, 2021

M Chart

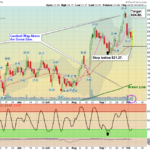
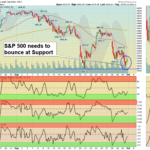
Markets were down this morning and recovered near the Close.  Volume was higher as more Buying came into the over-sold Indices again this morning. The S&P 500 Index is about half way down to the Green Line, and could be about finished with an … [Read more...]

October 5, 2021

Money Wave Alert! Oct 5, 2021

SPX Chart

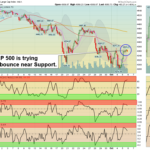
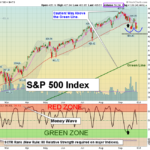
Markets were sharply higher today as Buying came in from over-sold Indices. The Big Tech Stocks finally bounced, but the Volume was still low on most. The S&P 500 Index is about half way down to the Green Line, and could be about finished with an … [Read more...]

October 4, 2021

Money Wave Alert! Oct 4, 2021

SPX Chart

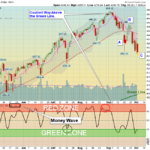
Markets were lower today as the Big Tech Stocks were under selling pressure. Semiconductors were down close to 3 %, but the Selling Volume was not high. The S&P 500 Index is about half way down to the Green Line, and could be about finished with … [Read more...]

October 3, 2021

Green Line Weekly Oct 3, 2021

Green Line Weekly

10/3/2021 Markets were lower this week, as the major Indices fell below the Red Lines (50-day avgs.) which caused many Short Term Investors to Go to Cash. The Selling has been mild, so the Indices should be able to re-test the Highs again in a few … [Read more...]

October 1, 2021

Money Wave Alert! Oct 1, 2021

QQQ Chart

Markets were much higher today as the S&P 500 Index bounced up at the Support of last week's Low of 4306. Then some above average Buying Volume came in. Now the S&P 500 Index might do a "W" pattern back up to re-test the Highs. Try to only … [Read more...]

September 30, 2021

Money Wave Alert! Sep 30, 2021

SPX Chart

Markets were lower today as the S&P 500 Index went all the way back down near last week's Low of 4306. Then some mild Buying came in on higher Volume. Now the S&P 500 Index needs to hold at last week's Low, and then maybe we will see a "W" … [Read more...]

September 29, 2021

Money Wave Alert! Sep 29, 2021

SPY Chart

Markets were higher today on average Volume, as the Indices became over-sold for the Short Term. Investors are worried about rising Interest Rates from Bonds dropping. Bonds are back Below the Green Line. Now the S&P 500 Index needs to hold at … [Read more...]

September 28, 2021

Money Wave Alert! Sep 28, 2021

TLT Chart

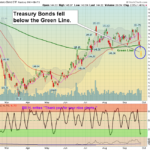
Markets were lower today on higher Volume, as Bonds slipped back Below the Green Line. This causes longer Term Interest Rates to rise, and the Big Tech Stocks don't like that.  Now the S&P 500 Index needs to hold at last week's Low of 4354. Then … [Read more...]

September 27, 2021

Money Wave Alert! Sep 27, 2021

CCJ Chart

Markets were mixed today on lower Volume, but the Energy and Metals Stocks had nice pops (see Watch List below). The Markets are no longer over-sold on the Short Term, as the Indices have rallied back up about half way to the early September Highs. … [Read more...]

  • « Previous Page
  • 1
  • …
  • 249
  • 250
  • 251
  • 252
  • 253
  • …
  • 363
  • Next Page »

Subscribe to Our Newsletter

AGL Logo

Get our eBook Now!

Candlestick - A Swing Traders Friend

We don’t spam! Read our privacy policy for more info.

You’ve been successfully subscribed to our newsletter!

Voted #1 at Stock Charts

SH Chart
Inverse S&P 500 Fund (SH) will have a Money Wave Buy today.

Help Us Help Animals

Help Us Help Animals

Recent Comments

  • Want to Protect Your Capital? Start With Better Position Sizing on Risk Management in Trading: Tools and Techniques
  • Want to Protect Your Capital? Start With Better Position Sizing on Swing Trading Risk Management: Tips To Safeguard Your Profits
  • Price Action Trading Strategies That Work in Any Market on What Is a Death Cross in Stocks? A Bearish Market Signal
  • ATGL Weekly Money Flow - 2025-07-13 on AGTL Top Pick of the Week! May 11, 2025
  • Market Breadth Indicators: A Trader’s Guide to Early Trend Detection on Backtesting: Definition and How a Trading Strategy Backtest Works

Become a Green Liner!

Help me make more Money in the Stock Market.

ON ATGL

  • DashBoard
  • Weekly Commentary
  • Daily Buy / Sell Signals
  • Day Trade Setup
  • Trading Rooms

Design & Develop By Pixelvect

STRATEGIES

  • Swing Trading
  • ATGL Pick of the Week
  • Dividend Growth
  • ETF Sector Rotation
  • Dogs of the Dow

HELP

  • ATGL Trading Rules
  • FAQ
  • Account Maintenance
  • Contact US
  • Join

FOLLOW US

Instagram Linkedin Twitter Facebook

© COPYRIGHT 2024 · ABOVETHEGREENLINE.COM · ALL RIGHTS RESERVED · PRIVACY · TERMS · CONTACT · WATCHLIST · CURRENT