Above the Green Line -01
  • Market Insights
        • Commentary
          • Daily
          • Weekly
        • BUY / SELL SIGNALS
          • Trade Posts
          • Recent Trade Alerts
          • Recent Day Trades
        • BLOGROLL
          • Dividend Growth Blog
          • ETF Sector Blog
          • Dow Dogs
          • TPOW Blog
  • Strategies
        • SWING TRADING
          • Current Positions
          • Watchlists
          • Closed Positions
          • Candidates - TOP 100
          • Specialty Stocks
        • WEEKLY STOCK PICK
          • TPOW Charts
          • TPOW Performance
          • TPOW Strategy Guide
          • TPOW Performance Dashboard
        • DAY TRADING
          • Watch List
        • ATGL DASHBOARD
        • ETF STRATEGIES
          • ETF Sector Rotation
          • ETF Sector Portfolio
        • DIVIDEND GROWTH
          • Dividend Growth Portfolio
          • Dividend Calendar
        • DOGS OF THE DOW
          • Dogs of the Dow Portfolio
          • DOW 5 Portfolio
  • Markets
        • US MARKET
          • Commodities
          • Energy
          • Precious Metals
          • Volatility
        • GLOBAL MARKETS
          • Market Indices
          • Economic Calendar
          • FOREX Heat Map
          • FOREX Cross Rates
          • Crypto Currency Market
  • Investing
    • Discord Community
    • Dashboard
  • Resources
        • ARTICLES
          • Dividend Growth Model Articles
          • ETF Articles
          • Investment Strategies Articles
          • Market and Economic Insights
          • Stock Trade Articles
          • Stock Reviews
        • TOOLS
          • Stock Scanners
          • Charting Software
          • Brokerage Firms
        • STOCK CHARTS
          • Key Components
          • Reading Charts
          • Drawing Stock Charts
          • Identifying Trends
        • RETIREMENT PLANNING
  • About
    • Contact Us
    • How to Win
    • #1 At Stockcharts
    • Disclaimer
    • FAQ
  • Log In
  • Subscribe

Stock Market Indexes

Stock Market Indexes


What are Market Indexes?

Above the Green Line lists the most common Global Market Indices used by Traders, Investors and Financial Institutions. Each index represents different segments of the market and/or global exchanges. The indices are a hypothetical portfolio of the companies associated with the financial segment.


Shown below is a list of some of the most popular Global Indexes followed by some lesser known indexes.

List of Most Popular Stock Market Indexes (Indices)

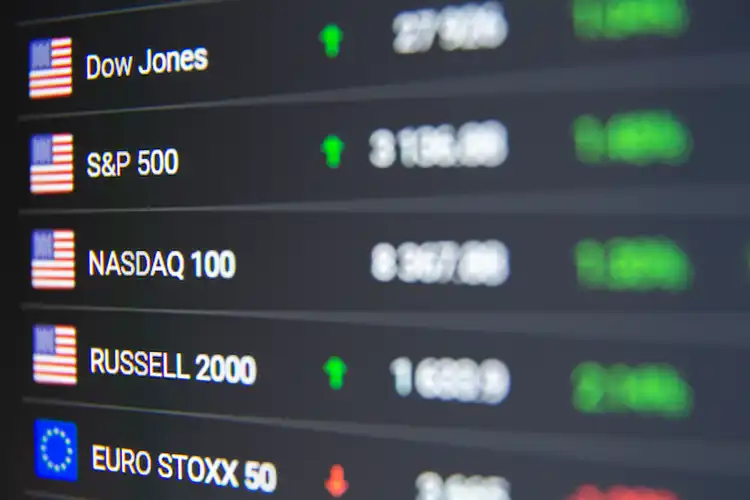
  • S&P 500 (SPX): measures 500 large-caps in U.S. stock market
  • Dow Jones 30 (DJI): compares 30 large-cap U.S. stocks
  • Nasdaq 100 (NDX): index made up of 103 largest non-financial companies
  • Russell 2000 (RUT): small-cap index of 2000 stocks
  • FTSE 100/Footsie (FTSE): 100 large-cap companies on London Stock Exchange
  • Dax 30 (DAX): 30 blue chip German stocks on Frankfurt Exchange
  • Nikkei 225 (NKY): 225 stocks on the Tokyo Stock exchange
  • Hang Seng Index (HSI): weighted index of Hong Kong’s largest companies
  • Nifty 50 (NIFTY): weighted average of 50 of the largest Indian companies

Other Stock Indexes

  • Nasdaq Composite
  • NYSE Composite
  • MSCI World
  • S&P/TSX Venture Composite Index
  • FTSE All-World index series
  • PSE Mining and Oil Index
  • VIX
  • BSE SENSEX
  • CAC 40
  • KOSPI
  • MERVAL
  • S&P 400
  • Hang Seng China H-Financials Index
  • FTSE All-World index series
  • Dow Jones Transportation Average
  • IBOVESPA
  • S&P/TSX Composite Index
  • SSE Composite Index
  • S&P/ASX 200
  • EURO STOXX 50
  • NYSE American Composite Index
  • Taiwan Capitalization Weighted Stock Index
  • BEL 20
  • MOEX Russia Index
  • Philadelphia Gold and Silver Index
  • PHLX Semiconductor Sector
  • Wilshire 5000
  • IBEX 35
  • Barron’s 400 Index
  • SZSE Component Index
  • Straits Times Index
  • S&P/NZX 50 Index
  • Indice de Precios y Cotizaciones
  • FTSE Bursa Malaysia KLCI
  • SZSE Component Index
  • All Ordinaries
  • Top 40 USD Net TRI
  • EURONEXT 100
  • TA-125 Index
  • AEX index
  • Russell 3000 Index
  • Russell 1000 Index
  • OMX Stockholm 30
  • Swiss Market Index

Subscribe to Our Newsletter

AGL Logo

Get our eBook Now!

Candlestick - A Swing Traders Friend

We don’t spam! Read our privacy policy for more info.

You’ve been successfully subscribed to our newsletter!

Voted #1 at Stock Charts

SH Chart
Inverse S&P 500 Fund (SH) will have a Money Wave Buy today.

Help Us Help Animals

Help Us Help Animals

Recent Comments

  • Market Breadth Indicators: A Trader’s Guide to Early Trend Detection on Backtesting: Definition and How a Trading Strategy Backtest Works
  • Island Reversal Pattern: Definition and Formation Explained on Double Top Pattern: How to Identify and Trade This Reversal Signal
  • Channel Pattern Guide: What It Is and Why It Matters on A Guide to Forecasting Using Moving Averages
  • What Is a Broadening Bottom Chart Pattern? Full Guide on Bull vs. Bear Market: An Investor’s Guide to Market Phases
  • ATGL Weekly Money Flow - 2025-05-11 on ATGL Top Pick of the Week! Apr 6, 2025

Become a Green Liner!

Help me make more Money in the Stock Market.

ON ATGL

  • DashBoard
  • Weekly Commentary
  • Daily Buy / Sell Signals
  • Day Trade Setup
  • Trading Rooms

Design & Develop By Pixelvect

STRATEGIES

  • Swing Trading
  • ATGL Pick of the Week
  • Dividend Growth
  • ETF Sector Rotation
  • Dogs of the Dow

HELP

  • ATGL Trading Rules
  • FAQ
  • Account Maintenance
  • Contact US
  • Join

FOLLOW US

Instagram Linkedin Twitter Facebook

© COPYRIGHT 2024 · ABOVETHEGREENLINE.COM · ALL RIGHTS RESERVED · PRIVACY · TERMS · CONTACT · WATCHLIST · CURRENT