Above the Green Line -01
  • Market Insights
        • Commentary
          • Daily
          • Weekly
        • BUY / SELL SIGNALS
          • Trade Posts
          • Recent Trade Alerts
          • Recent Day Trades
        • BLOGROLL
          • Dividend Growth Blog
          • ETF Sector Blog
          • Dow Dogs
          • TPOW Blog
  • Strategies
        • SWING TRADING
          • Current Positions
          • Watchlists
          • Closed Positions
          • Candidates - TOP 100
          • Specialty Stocks
        • WEEKLY STOCK PICK
          • TPOW Charts
          • TPOW Performance
          • TPOW Strategy Guide
          • TPOW Performance Dashboard
        • DAY TRADING
          • Watch List
        • ATGL DASHBOARD
        • ETF STRATEGIES
          • ETF Sector Rotation
          • ETF Sector Portfolio
        • DIVIDEND GROWTH
          • Dividend Growth Portfolio
          • Dividend Calendar
        • DOGS OF THE DOW
          • Dogs of the Dow Portfolio
          • DOW 5 Portfolio
  • Markets
        • US MARKET
          • Commodities
          • Energy
          • Precious Metals
          • Volatility
        • GLOBAL MARKETS
          • Market Indices
          • Economic Calendar
          • FOREX Heat Map
          • FOREX Cross Rates
          • Crypto Currency Market
  • Investing
    • Discord Community
    • Dashboard
  • Resources
        • ARTICLES
          • Dividend Growth Model Articles
          • ETF Articles
          • Investment Strategies Articles
          • Market and Economic Insights
          • Stock Trade Articles
          • Stock Reviews
        • TOOLS
          • Stock Scanners
          • Charting Software
          • Brokerage Firms
        • STOCK CHARTS
          • Key Components
          • Reading Charts
          • Drawing Stock Charts
          • Identifying Trends
        • RETIREMENT PLANNING
  • About
    • Contact Us
    • How to Win
    • #1 At Stockcharts
    • Disclaimer
    • FAQ
  • Log In
  • Subscribe

SSE Composite Index

SSE Composite Index

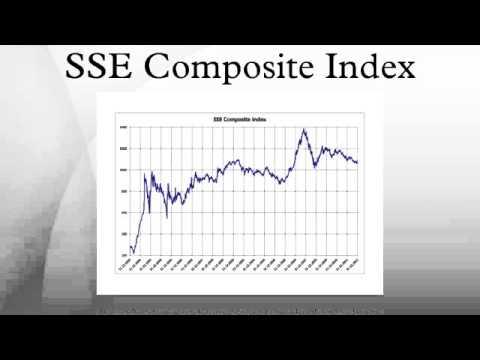
The SSE Composite Index, also known as the Shanghai Composite Index, is a stock market index that tracks the performance of all A-shares and B-shares listed on the Shanghai Stock Exchange (SSE). Established in 1990, it serves as a critical barometer of the Chinese stock market, reflecting the overall health and trends of China’s economy. The index includes a diverse range of sectors, such as finance, technology, consumer goods, and energy, making it a comprehensive measure of market activity.

Importance of the SSE Composite Index

The SSE Composite Index holds significant importance for several reasons:

  1. Economic Indicator: As the primary index of the Shanghai Stock Exchange, it provides valuable insights into the economic performance and investor sentiment in China, the world’s second-largest economy.
  2. Market Benchmark: The index serves as a benchmark for mutual funds and investment portfolios focused on Chinese equities. It enables investors to compare their performance against a standard measure.
  3. Global Influence: Given China’s growing role in the global economy, movements in the SSE Composite Index can impact international markets. Investors globally watch this index for signals regarding Chinese economic trends and potential market shifts.

Why Use the SSE Composite Index

Utilizing the SSE Composite Index can benefit investors for several reasons:

  • Broad Market Exposure: Investing in funds that track the SSE Composite Index allows for exposure to a wide array of sectors within the Chinese economy, promoting diversification and risk management.
  • Simplicity and Accessibility: The index simplifies the process of investing in Chinese equities, offering a single metric to monitor the overall market performance, making it easier for investors to stay informed.
  • Passive Investment Strategy: For those looking to adopt a passive investment approach, tracking the SSE Composite Index through index funds or ETFs can provide a straightforward way to invest in the Chinese market without active management.

Should You Invest in the SSE Composite Index?

Investing in the SSE Composite Index can be a strategic choice, but it is essential to consider individual financial goals and market conditions:

  1. Growth Potential: China’s economy has shown rapid growth, driven by urbanization, technological advancement, and an expanding consumer market. Investing in the SSE Composite Index can provide access to this growth potential.
  2. Diversification: For global investors, adding exposure to the SSE Composite Index can diversify portfolios, especially those heavily weighted in Western markets. This diversification can help mitigate risks associated with economic fluctuations in any single region.
  3. Market Volatility: The Chinese market can be volatile, influenced by regulatory changes, economic policies, and global economic conditions. Investors should be aware of these factors and consider their risk tolerance before investing.

In conclusion, the SSE Composite Index is a vital benchmark for the Chinese stock market, offering insights into economic performance and investment opportunities. Its diverse composition and accessibility make it an attractive option for those looking to invest in China. However, potential investors should carefully evaluate their financial goals, risk tolerance, and market dynamics before making investment decisions.

Related Articles

Mcclellan Oscillator

How to Use the McClellan Oscillator for Breadth-Based Trading Signals

Market breadth analysis offers traders a deeper understanding of the underlying market strength beyond simple price movements. The McClellan Oscillator ...
Read More
Keltner Channels

What Are Keltner Channels? Formula, Strategies & Comparison

Keltner Channels help traders visualize price movements within dynamic boundaries that adjust based on market volatility. Unlike static support and ...
Read More
Dead Cat Bounce

Dead Cat Bounce in Technical Analysis: Spotting the Bear Trap

A dead cat bounce represents one of the most deceptive phenomena in financial markets, capable of misleading even experienced traders ...
Read More
Coppock Curve

Coppock Curve Indicator Guide: Identifying Major Market Bottoms

The Coppock Curve is one of the most distinctive long-term momentum indicators in technical analysis, and it's specifically designed to ...
Read More
Scallop Patterns in Trading

How the Scallop Pattern Can Help You Anticipate Reversals

The scallop pattern is one of technical analysis's most reliable reversal indicators. This distinctive chart formation provides clear signals for ...
Read More
  • 1
  • 2
  • 3
  • …
  • 22
  • Next
Loading...

Subscribe to Our Newsletter

AGL Logo

Get our eBook Now!

Candlestick - A Swing Traders Friend

We don’t spam! Read our privacy policy for more info.

You’ve been successfully subscribed to our newsletter!

Voted #1 at Stock Charts

SH Chart
Inverse S&P 500 Fund (SH) will have a Money Wave Buy today.

Help Us Help Animals

Help Us Help Animals

Recent Comments

  • Spot Better Trading Signals With the McClelland Oscillator on Breakout Trading Strategy: How to Identify and Profit from Market Breakouts
  • Spot Better Trading Signals With the McClelland Oscillator on Best Technical Indicators for Day Trading Success
  • How Flash Crashes Really Happen (and What Traders Should Do About Them) on Long-Term vs. Short-Term Investment Strategies.
  • How Flash Crashes Really Happen (and What Traders Should Do About Them) on Best Technical Indicators for Day Trading Success
  • What Is a Calendar Spread and How to Trade It on IWM vs SPY: An ETF Comparison Analysis

Become a Green Liner!

Help me make more Money in the Stock Market.

ON ATGL

  • DashBoard
  • Weekly Commentary
  • Daily Buy / Sell Signals
  • Day Trade Setup
  • Trading Rooms

Design & Develop By Pixelvect

STRATEGIES

  • Swing Trading
  • ATGL Pick of the Week
  • Dividend Growth
  • ETF Sector Rotation
  • Dogs of the Dow

HELP

  • ATGL Trading Rules
  • FAQ
  • Account Maintenance
  • Contact US
  • Join

FOLLOW US

Instagram Linkedin Twitter Facebook

© COPYRIGHT 2024 · ABOVETHEGREENLINE.COM · ALL RIGHTS RESERVED · PRIVACY · TERMS · CONTACT · WATCHLIST · CURRENT