
By ATGL
Updated May 1, 2025
Recognizing trend reversals is critical to preserving profits and optimizing the timing of your trades. One powerful bearish reversal formation is the rounded top pattern. When spotted and traded correctly, it can offer an early warning that an uptrend is losing steam, providing an opportunity to reposition or protect your investments. This article will explain how to identify, understand, and trade the rounded top pattern across multiple markets.
Understanding the Rounded Top Pattern
The rounded top is a technical chart pattern that signals a gradual shift from bullish sentiment to bearish control.
Definition
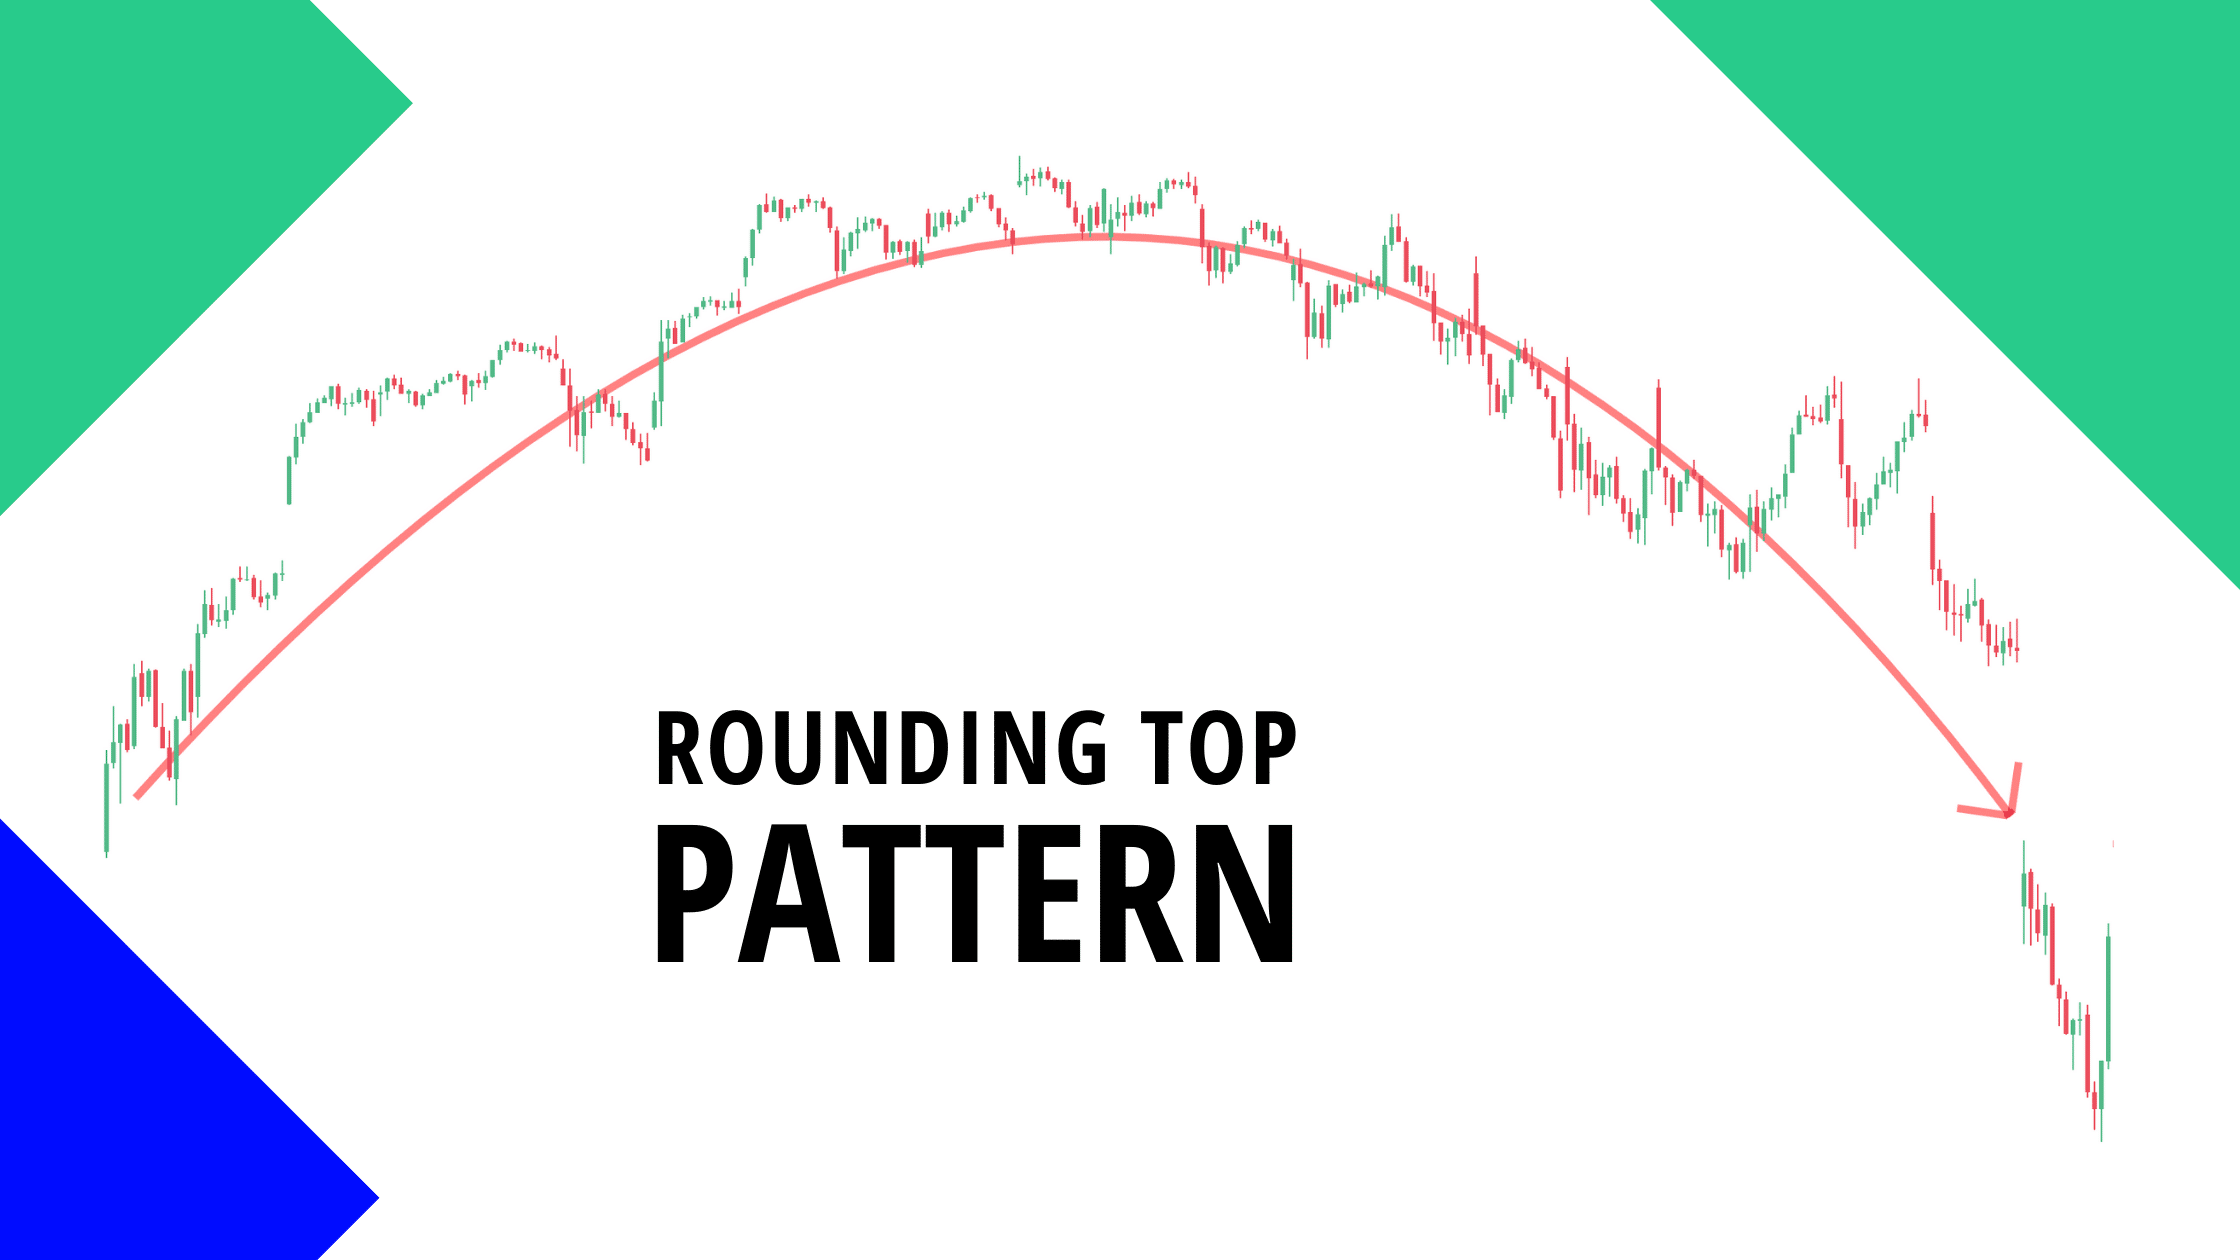
A rounded top is a long-term reversal pattern marked by a slow upward price curve that peaks and gradually transitions into a downward slope. It resembles an inverted “U” or a dome shape on a price chart, making it a distinctive shape among technical formations.
Characteristics
- Gradual Formation: It typically develops over weeks or months.
- Volume Behavior: Trading volume often increases during the initial rise, peaks near the top, and diminishes as the decline starts. Paying close attention to volume trends can significantly improve the accuracy of analyzing this pattern.
- Symmetrical Shape: The left and right sides of the rounded top often mirror each other.
- No Sharp Moves: Unlike head and shoulders patterns, the rounded top forms without sudden price drops or spikes.
Recognizing these characteristics allows you to anticipate a potential breakdown and prepare effective trading strategies.
How Does the Rounded Top Pattern Form?
The formation of a rounded top is the result of shifting market dynamics.
Initially, bullish sentiment drives prices higher. However, as prices reach new highs, momentum begins to slow. Buyers grow cautious, and sellers start exerting pressure, causing the price advances to become smaller. This transition is often visible on the price chart as smaller incremental gains give way to gradual declines.
This loss of upward momentum results in lower highs forming over time. Eventually, buyers capitulate, and selling pressure overcomes demand, leading to a sustained decline characterized by downward-trending prices.
Rounded tops occur during overbought conditions, excessive optimism, or when fundamentals fail to justify higher valuations. These patterns are particularly common at the end of major bull runs or during bearish market shifts that reflect broader economic or sector-specific changes.
How To Identify the Rounding Top Pattern
Successful trading requires precise identification of the rounded top.
Recognizing Lower Highs and Their Importance
A critical early sign of a developing rounded top is the appearance of progressively lower highs. This indicates that bulls are losing strength with each rally attempt. Unlike classic resistance lines, where highs match or slightly exceed each other, in a rounded top, each high retreats subtly compared to the last, forming a gentle arc on the price chart.
Observing volume trends alongside price action can strengthen confirmation. Ideally, volumes should diminish on upward moves and increase during declines, illustrating a growing bearish sentiment.
Plotting Resistance Lines Effectively
During a rounded top formation, a curved resistance line can be plotted connecting the successive lower highs. This line visually illustrates the rounding effect and helps anticipate future resistance at a key price level.
Instead of drawing straight horizontal resistance (common in rectangles and double tops), a gentle arc is used. Correct curve plotting increases the likelihood of identifying the pattern early.
Incorporating a technical indicator for trading, such as moving averages (e.g., the 50-day moving average crossing below the 200-day moving average), can offer additional confirmatory indicators of the weakening trend.
How To Trade With a Rounding Top: Key Strategies
Once a rounded top is identified, strategic execution becomes crucial.
Identify Completion
The pattern is considered complete when the price decisively breaks below a key support level — usually the base of the rounded top. Waiting for a confirmed breakdown at a critical price level minimizes false signals.
Entry points are often placed just below the support with a confirmation of increased volume and continued bearish trends.
Set Stop Losses
A stop loss is a predefined order placed with a broker to sell a security once it reaches a specific price level, limiting an investor’s potential loss on a position.
Setting stop losses slightly above the last minor high within the rounded top is prudent. This helps protect capital in case the breakdown proves temporary and the price rebounds, forming higher price bottoms.
Risk management should always align with the individual’s risk tolerance and the volatility of the security.
Combine With Other Indicators
Using oscillators like RSI or MACD crossovers can offer further confirmation. If these indicators show bearish divergence — where the price makes higher highs but indicators form lower highs — it supports the bearish reversal hypothesis.
It is equally important to read stock charts carefully and monitor multiple timeframes to make sure that the rounded top pattern is not just a short-term anomaly.
Applying Rounded Top Patterns Across Markets
Rounded tops are versatile patterns that occur across different asset classes.
Stocks
In equities, rounded tops often emerge after prolonged bull runs fueled by strong earnings or speculative buying. Recognizing them early can help you lock in profits before broader market declines, especially in periods marked by significant bearish trends.
Commodities
In commodity markets, rounded tops can signal the end of supply/demand imbalances, such as oil price surges followed by stabilization and decline. Monitoring volume trends in conjunction with price movement can enhance confidence in predicting a top.
Forex
Forex traders use rounded tops to detect shifts in currency pair momentum. For instance, a rounded top in EUR/USD after a sharp rally might predict a multi-week bearish phase characterized by consistent downward-trending prices.
Applying the pattern across different markets expands its utility and diversifies trading opportunities.
Benefits and Limitations of Rounded Tops
Benefits
- Early Reversal Signal: Provides ample warning compared to sharper reversal patterns.
- Broad Application: Effective across stocks, commodities, and currencies.
- Clear Structure: Easy to interpret with disciplined practice, especially when familiar with multiple technical patterns.
Limitations
- Subjective Identification: Without clear rules, misidentification is possible.
- Time-Consuming Formation: It can take months to fully develop, necessitating patience and careful observation.
- False Breakouts: Prices may temporarily break support but recover, creating whipsaws.
Traders must supplement the rounded top with other forms of market insights to increase trading success rates.
Identify and Trade the Rounded Top Pattern
Mastering the rounded top pattern is an essential skill when you’re aiming to spot bearish reversals early. By understanding its formation, characteristics, and trading strategies, you can protect gains and position for future market shifts.
Using a reliable technical indicator for trading, learning to read stock charts precisely, and constantly seeking updated market insights will dramatically improve your trading effectiveness. If you’re ready to elevate your trading strategies and improve pattern recognition, consider membership with Above the Green Line. Continue building your skills with our advanced technical analysis resources.

<h4>Related Articles</h4>

Margin Call Explained: What Triggers It and How to Avoid One

AMC Short Squeeze Explained: Timeline, Causes, and Trading Risks

Volatility Clustering in Financial Markets: Understand Why It Happens

Chaikin Money Flow (CMF): How to Use Volume to Spot Real Market Strength
