
By ATGL
Updated July 30, 2025
Identifying bullish reversal patterns separates profitable investments from missed opportunities. The pipe bottom chart pattern is a powerful indicator of trend reversal in declining markets. This distinctive formation provides you with clear entry signals and manageable risk parameters.
This comprehensive guide examines how to identify the pipe bottom pattern, execute profitable trades, validate signals through volume analysis, compare this formation to similar reversal patterns, and implement effective risk management strategies. Understanding these elements transforms pattern recognition from guesswork into a systematic trading methodology.
How To Spot the Pipe Bottom Pattern on Your Chart
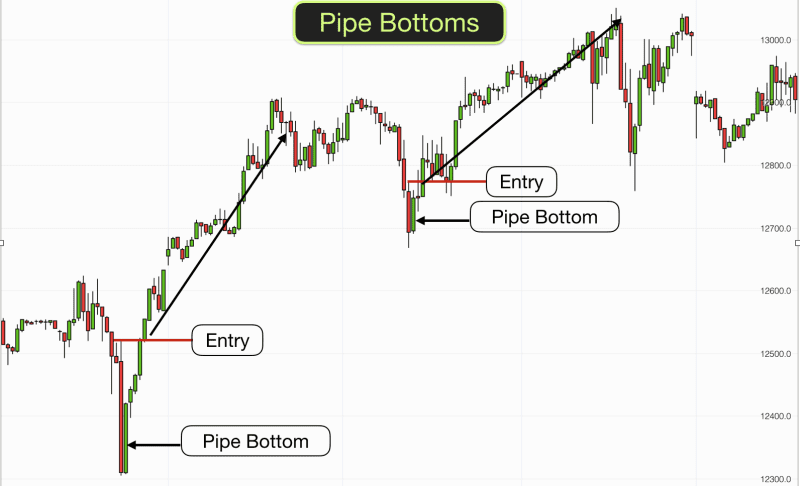
The pipe bottom pattern presents itself as two consecutive candlesticks with distinct characteristics that create an unmistakable visual signature. The first candle displays a long bearish body, representing significant selling pressure and downward momentum. The second candle mirrors this structure with a long bullish body of similar magnitude, indicating strong buying interest that completely reverses the previous session’s decline.
These two candles typically feature minimal upper and lower shadows, creating the “pipe” appearance that gives the pattern its name. The formation occurs across multiple timeframes, from intraday charts used in day trading patterns to weekly charts favored by position traders. Currency pairs, stock indices, and individual equities all exhibit this formation regularly.
What distinguishes the pipe bottom pattern from other reversal signals is its speed and decisiveness. While patterns like the rounding bottom pattern develop gradually over weeks or months, pipe bottoms form within just two trading sessions. This rapid formation often catches market participants off guard, creating opportunities for prepared traders.
The pipe top and bottom pattern represents the inverse relationship between bullish and bearish sentiment. A pipe top forms when a bullish candle precedes a bearish candle of similar magnitude, signaling potential downward reversal. The pipe bottom reverses this sequence, with bearish sentiment giving way to bullish momentum.
How To Tell If a Pipe Bottom Pattern Is Legit?
Distinguishing genuine pipe bottom formations from false signals requires careful analysis of candle symmetry and market context. Authentic patterns display remarkable balance between the bearish and bullish candles, with bodies measuring within 10% to 15% of each other in terms of price range. Shadows should remain minimal, typically representing less than 20% of the total candle range.
Price action context plays a vital role in pattern validation. Legitimate pipe bottoms appear after sustained downtrends or at significant support levels where buyers historically emerged. The pattern carries more weight when it forms near technical support zones, previous swing lows, or key moving averages that have provided support in prior market cycles.
Market structure surrounding the formation provides additional confirmation signals. Valid pipe bottoms often occur following periods of selling exhaustion, where volume spikes accompany the initial bearish candle before subsiding. The subsequent bullish candle should demonstrate conviction through price action that completely engulfs the previous session’s decline.
Confirming the Pattern with Volume Analysis
Volume analysis transforms pattern recognition from visual interpretation into quantitative validation. The ideal pipe bottom pattern exhibits increasing volume on both the bearish and bullish candles, with the bullish candle showing notably higher volume than recent sessions. This progression indicates growing participation and conviction among market participants.
Rising volume during the bullish candle formation suggests institutional interest and sustainable buying pressure. When volume accompanies the reversal candle but remains absent during the preceding decline, this divergence often signals genuine reversal momentum rather than temporary oversold bounces.
Volume spikes during pipe bottom formation frequently coincide with news events, earnings releases, or technical breakthrough levels. These catalysts provide fundamental backing for the technical signal, increasing the probability of successful trend reversal and sustained upward movement.
Trading Strategy: Entering on the Pipe Bottom Pattern
Entry timing determines the success of pipe bottom pattern trades. Conservative traders wait for the close of the bullish reversal candle before initiating positions, securing confirmation that buyers maintained control throughout the entire session. This approach sacrifices some profit potential for increased signal reliability.
Aggressive traders enter during the formation of the bullish candle once price action demonstrates clear reversal intent. This strategy requires monitoring intraday price movement and volume patterns to distinguish genuine reversals from temporary bounces. Entry signals strengthen when the bullish candle surpasses the midpoint of the bearish candle during active trading hours.
Position sizing should reflect the pattern’s success probability and the trader’s risk tolerance. The defined nature of pipe bottom patterns allows for precise risk calculation, as stop-loss levels are clearly established below the pattern’s low point. This clarity enables you to scale positions appropriately while maintaining consistent risk management principles.
Stop-Loss and Target Placement with Pipe Bottom Setups
Stop-loss placement below the pipe bottom pattern’s lowest point protects against failed reversals while allowing sufficient room for normal price fluctuation. Setting stops 2% to 5% below the pattern low accommodates typical market noise without triggering premature exits during minor retracements.
Profit targets should align with technical resistance levels, previous swing highs, or measured moves based on the pattern’s height. A conservative approach targets the nearest resistance level, while aggressive strategies project the pattern’s range above the breakout point. This measured move technique often provides realistic profit expectations based on the pattern’s inherent momentum.
Risk-reward ratios of 1:2 or better justify pipe bottom pattern trades, given their historical success rates when properly identified and confirmed. You should avoid patterns offering less favorable risk-reward profiles, as transaction costs and occasional losses require substantial winners to generate consistent profits.
How Pipe Bottom Patterns Compare to Similar Reversals
The pipe bottom pattern shares reversal characteristics with several other bullish formations while maintaining distinct advantages in speed and clarity. Unlike the double bottom pattern, which requires two separate testing phases of support levels, pipe bottoms complete their formation within consecutive sessions.
Cup and handle patterns develop over extended periods, creating rounded bottoms through gradual accumulation. Pipe bottoms achieve similar reversal outcomes through sharp, decisive price action that leaves little ambiguity about buyer intentions. This rapid formation often occurs within broader cup formations, serving as the final catalyst for breakout movements.
The broadening bottom pattern requires multiple swing points and extended development periods. Pipe bottoms offer more immediate gratification and clearer entry signals, though they may provide smaller profit potential than these larger formations. Each pattern serves different trading styles and timeframe preferences.
When markets transition from bearish to bull market conditions, pipe bottom patterns frequently appear at intermediate swing lows, providing tactical entry opportunities during larger trend changes. These formations complement longer-term bullish strategies by offering precise entry timing with defined risk parameters.
Tips To Avoid Common Mistakes With the Pipe Bottom Pattern
Premature entry represents the most frequent error made with pipe bottom patterns. Rushing into positions before the bullish candle completes often results in false signals and unnecessary losses. Patience during pattern formation protects capital and increases success rates.
Misinterpreting candle structure leads to identification errors that compromise trading results. Genuine pipe bottoms require substantial body sizes on both candles, with minimal shadows disrupting the clean reversal appearance. Patterns with extensive shadows or small bodies lack the conviction necessary for reliable reversal signals.
Ignoring volume confirmation undermines pattern reliability and increases failure rates. Pipe bottoms without supporting volume often represent temporary oversold bounces rather than sustainable trend reversals. Volume analysis should always accompany visual pattern recognition to validate trading signals.
Context neglect causes traders to pursue patterns in inappropriate market conditions. Pipe bottoms appearing during strong downtrends without nearby support levels face higher failure rates than those forming near established technical levels. Market structure analysis prevents traders from fighting dominant trends.
Apply the Pipe Bottom Pattern to Your Trading Plan
Ready to enhance your pattern recognition skills and develop more sophisticated trading strategies? Above the Green Line’s membership program offers comprehensive training on pipe bottom patterns and dozens of other proven formations. Access expert analysis, real-time pattern alerts, and detailed trading strategies that transform technical analysis knowledge into consistent profits.

Related Articles

Margin Call Explained: What Triggers It and How to Avoid One

AMC Short Squeeze Explained: Timeline, Causes, and Trading Risks

Volatility Clustering in Financial Markets: Understand Why It Happens

Chaikin Money Flow (CMF): How to Use Volume to Spot Real Market Strength
