Above the Green Line -01
  • Market Insights
        • Commentary
          • Daily
          • Weekly
        • BUY / SELL SIGNALS
          • Trade Posts
          • Recent Trade Alerts
          • Recent Day Trades
        • BLOGROLL
          • Dividend Growth Blog
          • ETF Sector Blog
          • Dow Dogs
          • TPOW Blog
  • Strategies
        • SWING TRADING
          • Current Positions
          • Watchlists
          • Closed Positions
          • Candidates - TOP 100
          • Specialty Stocks
        • WEEKLY STOCK PICK
          • TPOW Charts
          • TPOW Performance
          • TPOW Strategy Guide
          • TPOW Performance Dashboard
        • DAY TRADING
          • Watch List
        • ATGL DASHBOARD
        • ETF STRATEGIES
          • ETF Sector Rotation
          • ETF Sector Portfolio
        • DIVIDEND GROWTH
          • Dividend Growth Portfolio
          • Dividend Calendar
        • DOGS OF THE DOW
          • Dogs of the Dow Portfolio
          • DOW 5 Portfolio
  • Markets
        • US MARKET
          • Commodities
          • Energy
          • Precious Metals
          • Volatility
        • GLOBAL MARKETS
          • Market Indices
          • Economic Calendar
          • FOREX Heat Map
          • FOREX Cross Rates
          • Crypto Currency Market
  • Investing
    • Discord Community
    • Dashboard
  • Resources
        • ARTICLES
          • Dividend Growth Model Articles
          • ETF Articles
          • Investment Strategies Articles
          • Market and Economic Insights
          • Stock Trade Articles
          • Stock Reviews
        • TOOLS
          • Stock Scanners
          • Charting Software
          • Brokerage Firms
        • STOCK CHARTS
          • Key Components
          • Reading Charts
          • Drawing Stock Charts
          • Identifying Trends
        • RETIREMENT PLANNING
  • About
    • Contact Us
    • How to Win
    • #1 At Stockcharts
    • Disclaimer
    • FAQ
  • Log In
  • Subscribe

PHLX Semiconductor Sector Index

PHLX Semiconductor Sector Index

What is the PHLX Semiconductor Sector?

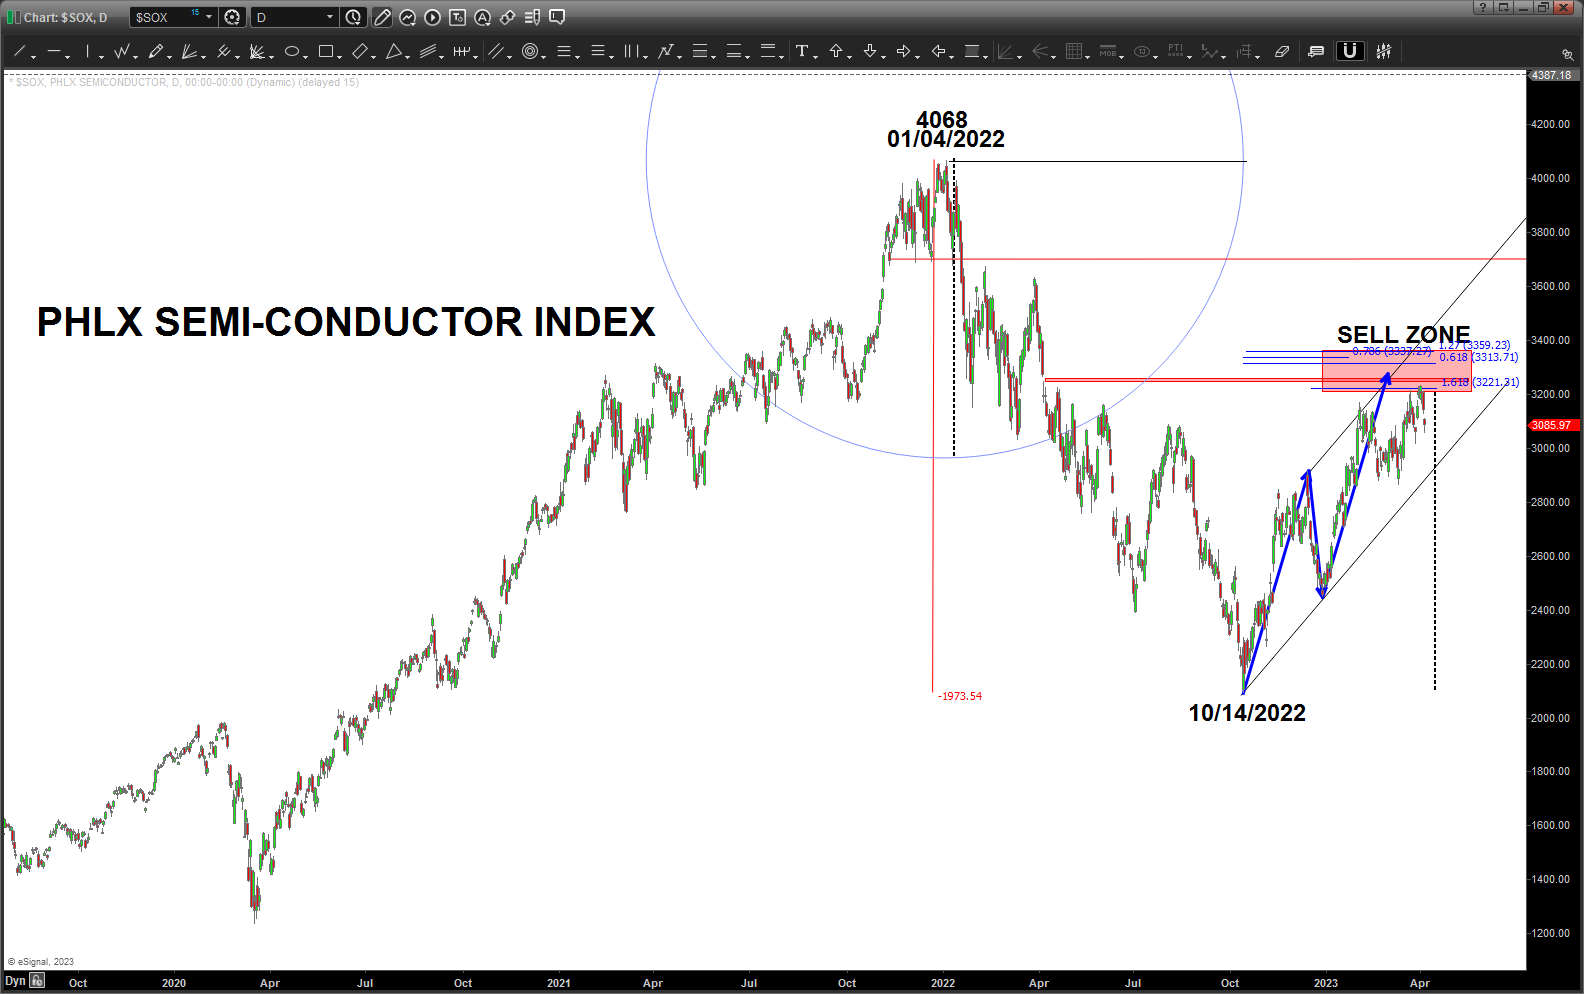
The Philadelphia Stock Exchange (PHLX) Semiconductor Sector is a key index that tracks the performance of companies engaged in the semiconductor industry. This sector includes firms involved in the design, distribution, manufacture, and sale of semiconductors, which are essential components in a multitude of electronic devices, from computers and smartphones to appliances and automobiles. The PHLX Semiconductor Index (SOX) serves as a benchmark for investors looking to assess the health and trajectory of the semiconductor market, which is a vital segment of the broader technology sector.

Importance of the PHLX Semiconductor Sector

  1. Technological Backbone: Semiconductors are critical to modern technology. As the demand for electronics continues to surge, the semiconductor industry plays a crucial role in driving innovation across various sectors, including consumer electronics, telecommunications, automotive, and healthcare.
  2. Economic Indicator: The performance of the semiconductor sector often serves as a leading indicator of economic health. Given its integral role in numerous industries, trends in semiconductor sales and production can signal broader economic conditions. A strong semiconductor sector typically suggests robust demand for technology and consumer goods.
  3. Investment Opportunities: The PHLX Semiconductor Index includes some of the largest and most influential semiconductor companies in the world, such as Intel, NVIDIA, and AMD. As these companies innovate and expand, they offer significant investment opportunities.

Why You Should Use the PHLX Semiconductor Sector

  1. Diversification: Investing in the PHLX Semiconductor Sector allows investors to gain exposure to a diverse range of companies within the semiconductor industry. This diversification can help mitigate risks associated with investing in individual stocks.
  2. Growth Potential: The semiconductor industry has historically shown significant growth potential, driven by technological advancements and increasing demand for electronics. Investing in this sector can position investors to benefit from future growth trends, such as the rise of artificial intelligence, Internet of Things (IoT), and 5G technologies.
  3. Market Insight: Tracking the PHLX Semiconductor Index can provide valuable insights into market trends and emerging technologies. Investors can use this information to make informed decisions about their investment strategies.

Should You Invest in the PHLX Semiconductor Sector?

Investing in the PHLX Semiconductor Sector can be a lucrative opportunity, but it also comes with its share of risks. Here are some factors to consider:

  1. Market Volatility: The semiconductor sector can be highly volatile, influenced by factors such as supply chain disruptions, technological advancements, and shifts in consumer demand. Investors should be prepared for price fluctuations and conduct thorough research before making investment decisions.
  2. Long-Term Outlook: While short-term gains can be enticing, it’s essential to take a long-term perspective. The semiconductor industry is poised for continued growth, especially with the ongoing digital transformation across industries.
  3. Diversification Strategy: If you decide to invest in the PHLX Semiconductor Sector, consider how it fits into your overall investment strategy. Diversifying your portfolio by including different sectors can help manage risk and improve overall returns.

In conclusion, the PHLX Semiconductor Sector offers a unique opportunity for investors to tap into the rapidly evolving technology landscape. While there are risks associated with investing in this sector, the potential for growth and the importance of semiconductors in the global economy make it a worthwhile consideration for many investors. As always, careful research and a clear understanding of your investment goals are crucial for success in the dynamic world of semiconductor investments.


Related Articles

Mcclellan Oscillator

How to Use the McClellan Oscillator for Breadth-Based Trading Signals

Market breadth analysis offers traders a deeper understanding of the underlying market strength beyond simple price movements. The McClellan Oscillator ...
Read More
Keltner Channels

What Are Keltner Channels? Formula, Strategies & Comparison

Keltner Channels help traders visualize price movements within dynamic boundaries that adjust based on market volatility. Unlike static support and ...
Read More
Dead Cat Bounce

Dead Cat Bounce in Technical Analysis: Spotting the Bear Trap

A dead cat bounce represents one of the most deceptive phenomena in financial markets, capable of misleading even experienced traders ...
Read More
Coppock Curve

Coppock Curve Indicator Guide: Identifying Major Market Bottoms

The Coppock Curve is one of the most distinctive long-term momentum indicators in technical analysis, and it's specifically designed to ...
Read More
Scallop Patterns in Trading

How the Scallop Pattern Can Help You Anticipate Reversals

The scallop pattern is one of technical analysis's most reliable reversal indicators. This distinctive chart formation provides clear signals for ...
Read More
  • 1
  • 2
  • 3
  • …
  • 22
  • Next
Loading...

Subscribe to Our Newsletter

AGL Logo

Get our eBook Now!

Candlestick - A Swing Traders Friend

We don’t spam! Read our privacy policy for more info.

You’ve been successfully subscribed to our newsletter!

Voted #1 at Stock Charts

SH Chart
Inverse S&P 500 Fund (SH) will have a Money Wave Buy today.

Help Us Help Animals

Help Us Help Animals

Recent Comments

  • Spot Better Trading Signals With the McClelland Oscillator on Breakout Trading Strategy: How to Identify and Profit from Market Breakouts
  • Spot Better Trading Signals With the McClelland Oscillator on Best Technical Indicators for Day Trading Success
  • How Flash Crashes Really Happen (and What Traders Should Do About Them) on Long-Term vs. Short-Term Investment Strategies.
  • How Flash Crashes Really Happen (and What Traders Should Do About Them) on Best Technical Indicators for Day Trading Success
  • What Is a Calendar Spread and How to Trade It on IWM vs SPY: An ETF Comparison Analysis

Become a Green Liner!

Help me make more Money in the Stock Market.

ON ATGL

  • DashBoard
  • Weekly Commentary
  • Daily Buy / Sell Signals
  • Day Trade Setup
  • Trading Rooms

Design & Develop By Pixelvect

STRATEGIES

  • Swing Trading
  • ATGL Pick of the Week
  • Dividend Growth
  • ETF Sector Rotation
  • Dogs of the Dow

HELP

  • ATGL Trading Rules
  • FAQ
  • Account Maintenance
  • Contact US
  • Join

FOLLOW US

Instagram Linkedin Twitter Facebook

© COPYRIGHT 2024 · ABOVETHEGREENLINE.COM · ALL RIGHTS RESERVED · PRIVACY · TERMS · CONTACT · WATCHLIST · CURRENT