
The Markets popped back up to the Highs this morning on higher Oil, but are now weakening. The NAZ and Small Caps are down. The S&P 500 is holding above the August High of 2194 . More Money Wave Buy Signals soon.
Money Wave Buys soon!
The Following Investments will probably have a Money Wave Buy Signal
(Slow Stochastic Closing > 20) on today’s Close.
None Today
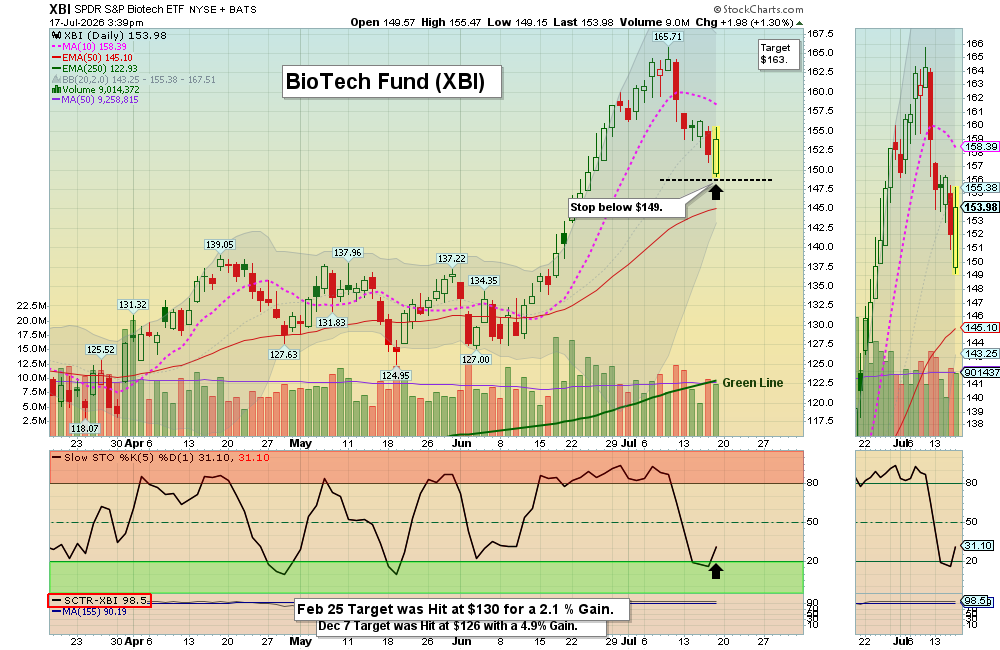
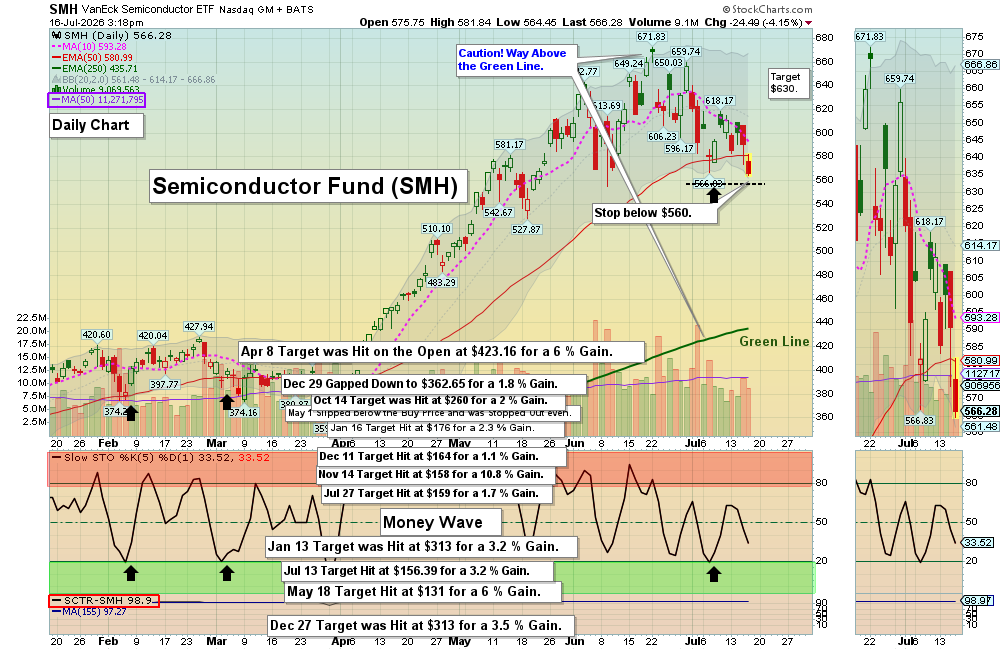
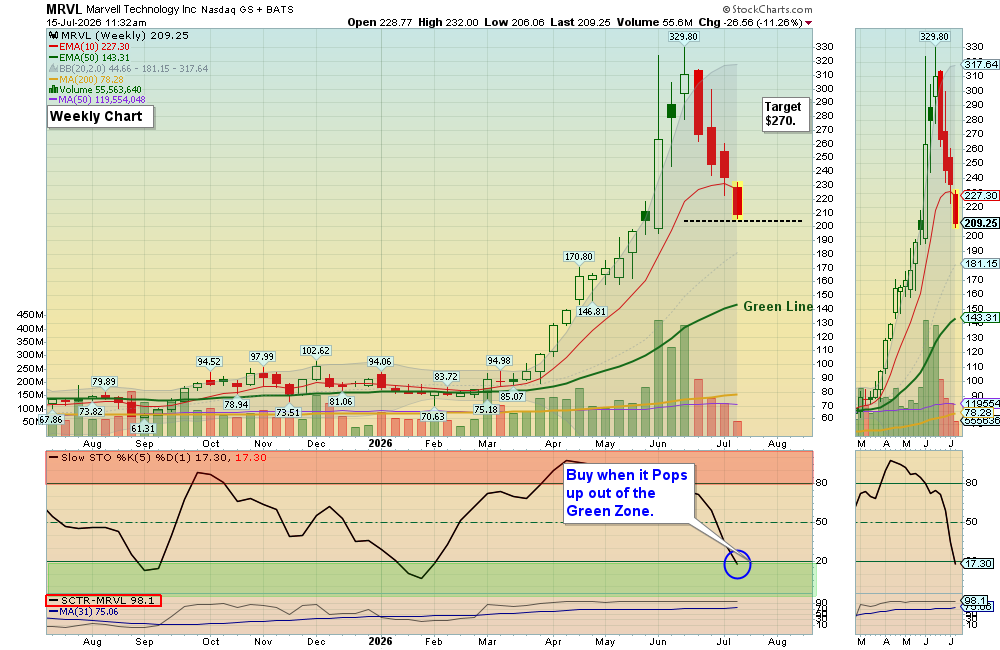
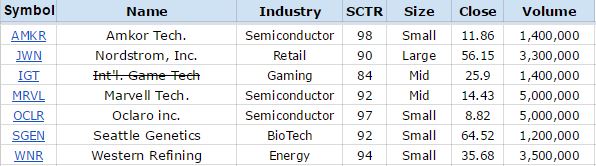
ON DECK: AMKR MRVL OCLR SGEN WNR
WAIT for Money Waves Buys soon coming out of the Green Zones. We will email you when they are ready.
Click for WATCH LIST
Click for STOCKCHARTS LIST
Click for OPEN POSITIONS
Many like to buy the day before, if the Investment has not popped up too much.
Money Wave Buys are usually good for a 3-6 % move in a few days.
About 1/3 of the time, the Money Wave Buys will result small losses, so please use a Sell Stop Loss after all Buy orders.
Why are you not showing GS, AMZN, etc in your recommended portfolio on your website but you do show them on Stockcharts.com?
Thank you for your question.
GS has been added to the Top 100 list (it was already in the filter for Money Wave Buys) .
AMZN is not on the Watch List, as the SCTR (Relative Strength) is Below 90.
The Relative Strengths are changing quickly now, as many Investments are reaching full historic values…
Also, with $INDU on way down, with $nasdaq more then 1/2 way down and AMZN below 20 on 5,1 stock, will they bounce while $INDU has further to go down ?
The WEAKEST go down first… Big CAP Globalist Stocks have become weak (AMZN GOOGL FB NFLX AAPL) from Trump logic.
It is better to wait on the Strongest to become over-sold, than to just pile in the first ones into the Green Zones… Normally the Leaders will Return to their Red Lines, if you will be patient.
A while back you showed a chart for an ETF that goes the opposite direction of the S&P 500, or possibly the NASDAQ equivalent. It was a suggestion to consider if the overall market kept shooting up and was due for a fall. Possibly you could show the recommendation to us again.
Thanks;
Bartthehumble
It is still too early for Inverse Funds like SH. Sorry the hyperlinks don’t work on this page… you will have to copy & paste:
http://www.stockcharts.com/h-sc/ui?s=SH&p=D&yr=10&mn=2&dy=0&id=p84586051931&a=308233791
The Leaders like NVDA should eventually come down to the Green Line, and go back up.
Indices are just inferior Investments… We only care about the top 10%!
Did I miss it, or is there a reason you are now using the 155 MA indicator on the SCTR?
Thanks for asking. The SCTR Ranking system that StockCharts uses is weighted too fast to the last 90-days of trading, instead of a full year like http://www.etfscreen.com and Investor’s Daily Relative Strength Values. One of our followers, Andrew, suggested using a moving average of the SCTR. Using a 155 day average seems to work well, especially if the 155 day stays up high whiles the short term SCTR dumps.