
Markets are down slightly today, as the Leaders are slowly returning to their Green Zones, to create Money Wave Buys again.
Most of the strongest Leaders are still above their Pink Lines (10-day avgs.) WAIT for Green Zone Buys.
The Tech Fund and BioTech Fund made New Highs recently, and they should have good bounces from their Green Zones.
Crude Oil is down today at $47.60 / barrel.
______________________________________________________________________________________________
Money Wave Buys soon!
The Following Investments will probably have a Money Wave Buy Signal
(Slow Stochastic Closing > 20) on today’s Close.
BUYS TODAY:
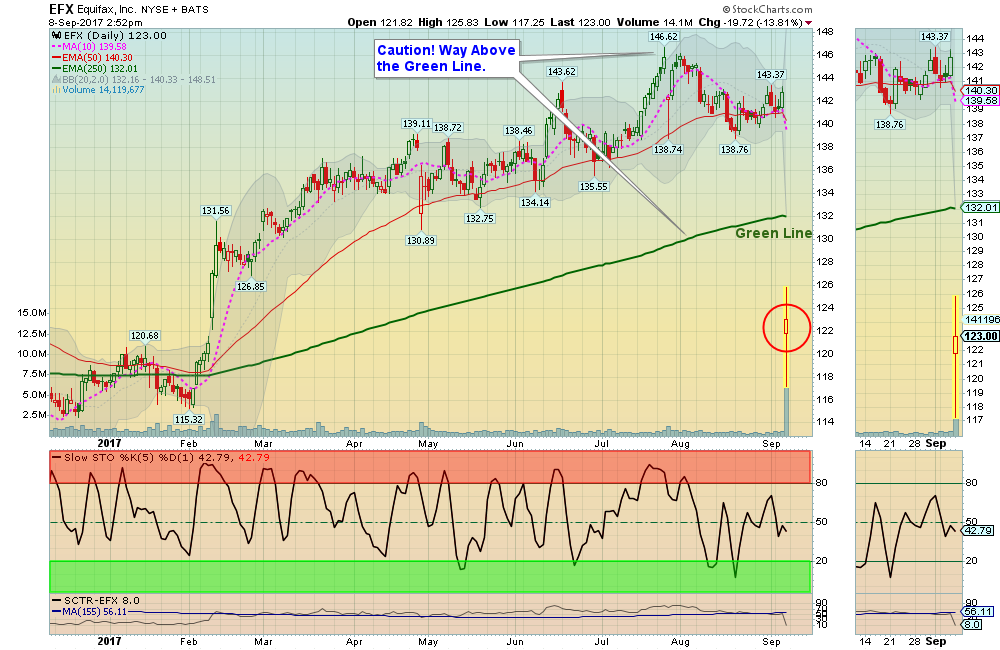
BA BOEING CORP Money Wave Buy today. We will not log BA, as it is Way Above the Green Line.
Be patient and WAIT for Money Wave Buy soon for: EA ELECTRONIC ARTS, GLUU GLU MOBILE INC, IMGN IMMUNOGEN INC, & WTW WEIGHT WATCHERS INC. We will email you when they are ready. Click on WatchList
Emotions are very high now, so please do not Buy unless you are VERY NIMBLE. The Leaders are still Way Above the Green Lines (all Investments eventually return to their Green Lines).
______________________________________________________________________________________________
SELLS TODAY:
EXIT FB FACEBOOK INC. if it is going to Close below the Pink Line around $170.24.
PORTFOLIO (Open Positions)
Click for CLOSED POSITIONS
Many like to Buy the day before, near the Close, if the Money Wave is going to create a Buy Signal (Closing > 20).
Don’t Buy if the Investment has already popped up too much. Money Wave Buys are usually good for a 3-6 % move in a few days. We will “Not Log” trades if the Reward/Risk is not at least 2:1.
HAVE A GREAT WEEKEND!