
Watchlist and Charts to Buy Soon.
| Daily Swing Watch List | Daily Swing Charts to Buy |
| Current Swing Positions | Current Swing Charts |
| Closed Results | Trading Dashboard |
Current Pick and Chart
| Top Pick of the Week | TPOW Stock Chart |
ETF SECTOR ROTATION SYSTEM The 3rd Quarter ends today, and we will sell all 5 Fund on the Close today. Tomorrow on the Close we will Buy 20 % in these 5 Funds: SPY – S&P 500 Fund, QQQ – NASDAQ 100 Fund, XLF – Financial Fund, IWM – Small Cap Fund, and SLV – Silver Fund. Or you can replace GDX & EEM with IWM & SLV on tomorrow’s Close and allocate 20% into each Fund for the quarterly rotation.
Sep 30, 2025 Today the markets opened on a slightly weaker note following yesterday’s moves, with SPY holding at a lower high relative to its previous peak. From here, we could either see another extended wave to the upside or a rollover back toward the banana line, so caution remains key. The biotech ETF pushed higher, showing signs of money rotation into stronger sectors, while the greed index SVXY formed an M-pattern but stayed firm.
Overall, markets remained slightly weaker yet still holding up, though without a strong higher high, retracement toward the banana line could begin soon, trapping dumb money. Meanwhile, our daily Swing Trades continue to perform well, with good corrections and retracement setups that may deliver the best swing trades in the sessions ahead.
Wait for more Buy Signals coming up out of the Green Zones. WATCH LIST CHARTS
The best moves happen when the S&P 500 Index is also coming up out of the Green Zone.
______________________________________________________________________________
BUYS TODAY 9/30/2025
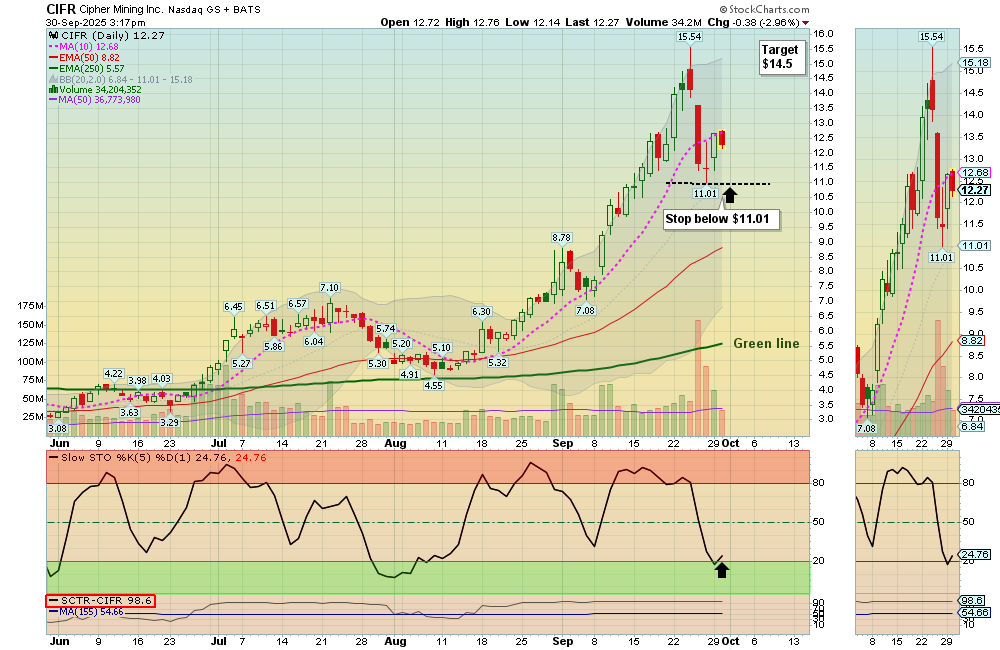
CIFR Cipher Mining. Swing Trade Buy on the Close, but it is near the previous highs (2 Star trade).
BUYS SOON
| Open Date | Symbol | Description | Industry | SCTR | Size | Last Price | Daily Change % | ATGL 60 Min | Comments | id | Strategy | Position | Sell Date | Sell Price | Purchase Price | Net Profit | Realized Gain/Loss % | ATGL Rule | Stop Loss | color | Chart | Update Date | Status | Unrealized Gain/Loss % | Volume | Post Type | # Shares | Amount Invested | Portfolio Weight | Dividend Rate | Current Yield | Current Value | Yield on Cost | Projected Annual Dividends | Total Dividends Received | Pay Back | Profit / Loss | Annualized Profit/Loss | Star Rating | Target Price | News Alert % | Target Triggered |
|---|---|---|---|---|---|---|---|---|---|---|---|---|---|---|---|---|---|---|---|---|---|---|---|---|---|---|---|---|---|---|---|---|---|---|---|---|---|---|---|---|---|---|
| 2026-03-26 | SNDK | Sandisk Corp. | Semiconductor | 99 | Large | $615.83 | 2.0989 | Wait for next Daily Money Wave Close > 20 with High Volume. | 5010 | Short Term | Long | $0.00 | 0.00% | https://stockcharts.com/sc3/ui/?s=SNDK&a=2116938080&p=D&yr=0&mn=6&dy=0&id=p30813991236 | 2026-03-26 15:35:08 | open | 0.00% | 16836810 | Watch List | $0 | 0.00% | 0.00 | 0 | $0 | 0.00% | $0 | $0 | 0.00% | 0.00% | - | $720.00 | |||||||||||
| 2026-03-26 | AMPX | Amprius Tech | Industrial | 94 | Small | $16.12 | -6.0606 | Wait for next Daily Money Wave Close > 20 with High Volume. | 5011 | Short Term | Long | $0.00 | 0.00% | https://stockcharts.com/sc3/ui/?s=AMPX&a=2015211659&p=D&yr=0&mn=4&dy=0&id=p23048837358 | 2026-03-26 22:49:11 | open | 0.00% | 6943610 | Watch List | $0 | 0.00% | 0.00 | 0 | $0 | 0.00% | $0 | $0 | 0.00% | 0.00% | - | $19.00 | |||||||||||
| 2026-03-24 | MU | Micron Tech. | Semiconductor | 98 | Large | $357.22 | 0.4951 | Wait for next Daily Money Wave Close > 20 with High Volume. | 5008 | Short Term | Long | $0.00 | 0.00% | https://stockcharts.com/sc3/ui/?s=MU&a=1659646208&p=D&yr=0&mn=4&dy=0&id=p30932029130 | 2026-03-24 16:38:04 | open | 0.00% | 46028972 | Watch List | $0 | 0.00% | 0.46 | 0.1288 | $0 | 0.00% | $0 | $0 | 0.00% | 0.00% | - | $450.00 |
Shop for a better price earlier in the day with Green Candle Buy Signal, on the same day that a Daily Money Wave Buy Signal will occur.
Many like to Buy the Swing Trades just before the Close, if the Money Wave is going to create a Buy Signal (Closing > 20 and up out of the Green Zone). Don’t Buy if the Security has already popped up too much. Money Wave Buy Signals are usually good for a 3-6 % move in a few days.
SELLS TODAY NONE TODAY
________________________________________________________________________
WEEKLY GREEN ZONE POPS (Will Price these after Friday’s Close).
WEEKLY SWING TRADING (Formerly LONG TERM)Watchlist and Charts to Buy Soon.
| Weekly Swing Watch List | Weekly Swing Charts to Buy |
| Current Weekly Positions | Current Weekly Charts |
| Closed Results | Stage Chart Investing |
DAY TRADING SETUPS. Today we had 14 scalp trades for nice Gains at our Trading Room. In this Emotional Market now, Day Trading Alerts are not being sent out on our Discord Site with Live Chatting. Please install Discord app on your PC or cell for mobile notifications. Check out our Live Stream.
Or look for Green Candle Buy Pops (Red Candle turns Green). Big Movers today: APLD+5% HOOD +4% & BE +15%
Bonds were down today and are Above the Green Line.
Crude Oil was down $0.80 today at $62.60.
MY TRADING DASHBOARD
SWING TRADING CURRENT POSITIONS
DAY TRADING SETUPS
TRADE ALERTS
STAGE CHART INVESTING
PREVIOUS GREEN LINE STOCKS