Above the Green Line -01
  • Market Insights
        • Commentary
          • Daily
          • Weekly
        • BUY / SELL SIGNALS
          • Trade Posts
          • Recent Trade Alerts
          • Recent Day Trades
        • BLOGROLL
          • Dividend Growth Blog
          • ETF Sector Blog
          • Dow Dogs
          • TPOW Blog
  • Strategies
        • SWING TRADING
          • Current Positions
          • Watchlists
          • Closed Positions
          • Candidates - TOP 100
          • Specialty Stocks
        • WEEKLY STOCK PICK
          • TPOW Charts
          • TPOW Performance
          • TPOW Strategy Guide
          • TPOW Performance Dashboard
        • DAY TRADING
          • Watch List
        • ATGL DASHBOARD
        • ETF STRATEGIES
          • ETF Sector Rotation
          • ETF Sector Portfolio
        • DIVIDEND GROWTH
          • Dividend Growth Portfolio
          • Dividend Calendar
        • DOGS OF THE DOW
          • Dogs of the Dow Portfolio
          • DOW 5 Portfolio
  • Markets
        • US MARKET
          • Commodities
          • Energy
          • Precious Metals
          • Volatility
        • GLOBAL MARKETS
          • Market Indices
          • Economic Calendar
          • FOREX Heat Map
          • FOREX Cross Rates
          • Crypto Currency Market
  • Investing
    • Discord Community
    • Dashboard
  • Resources
        • ARTICLES
          • Dividend Growth Model Articles
          • ETF Articles
          • Investment Strategies Articles
          • Market and Economic Insights
          • Stock Trade Articles
          • Stock Reviews
        • TOOLS
          • Stock Scanners
          • Charting Software
          • Brokerage Firms
        • STOCK CHARTS
          • Key Components
          • Reading Charts
          • Drawing Stock Charts
          • Identifying Trends
        • RETIREMENT PLANNING
  • About
    • Contact Us
    • How to Win
    • #1 At Stockcharts
    • Disclaimer
    • FAQ
  • Log In
  • Subscribe

September 21, 2020

Money Wave Alert! Sep 21, 2020

SPX Chart
The S&P 5oo Index could be having an A-B-C correction down.

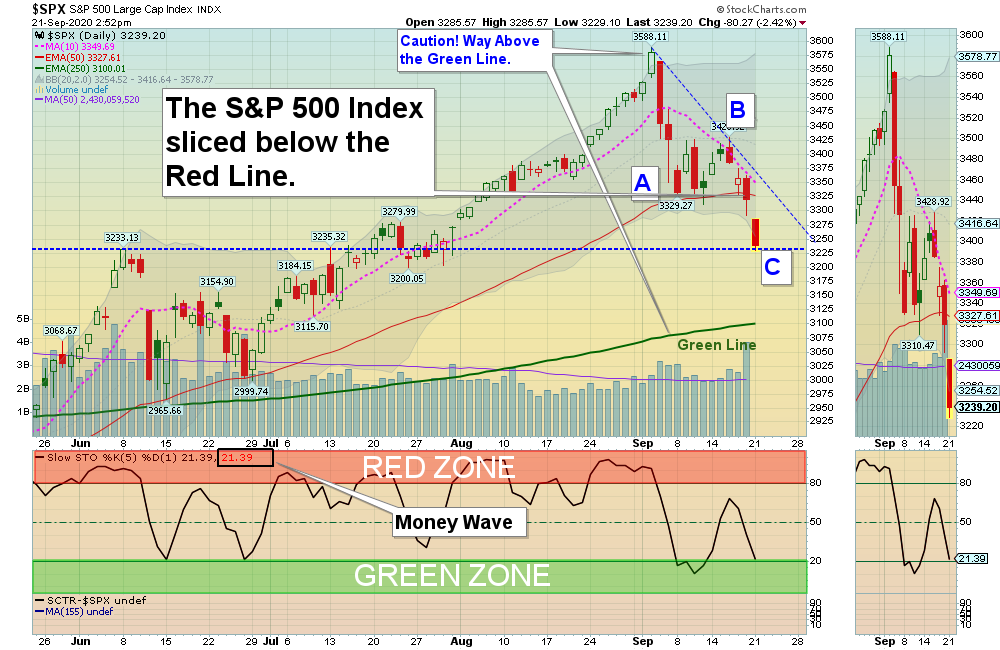
Markets were down again today as the World Markets were weak. The S&P 500 slipped below the Red Line 50-day avg.) of 3328, so now it need to hold above the June High of 3232 for this decline to be an A-B-C correction on the S&P 500 Index). It looks like the Pink Lines (10-day avgs.) are resistance before Buying most Investments at this time. 

Try to Buy only the very Strongest Leaders that hold above their Red Lines (50-day avgs.) for the fastest bounces. he Markets are struggling to stay above the the Red Lines (3331 on the S&P 500 Index).

Buy the Leaders below when they pop up out of the Green Zones for Money Wave Buy Signals soon. 

Please remember that the Markets are up 51 % from the March Lows, and are over-bought from extreme Confidence and Hope. 

Bonds  were up today. 

Crude Oil was down $1.57 today at $39.54.

BUYS TODAY    9/21/2020   

ZS       ZSCALER INC.      Bought today above the Pink Line of $131.14 with a 3% Trailing Sell Stop Loss below it. Target is $155.00.

JUMP START: (Buy Signal should be very soon… Click on the Jump Start link for more info.) 

AMD      ADVANCED MICRO INC.      Buy above the Pink Line of $77.80 with a 5% Trailing Sell Stop Loss below it.

BIG      BIG LOTS INC.      Buy above the Pink Line of $46.14 with a 5% Trailing Sell Stop Loss below it.

NVDA     NVIDIA CORP.      Buy above the Pink Line of $498.10 with a 5% Trailing Sell Stop Loss below it. 

____________________________________________________________________________________________________________

WATCH LIST

Money Wave Buys Signals Soon (3 Days-3 Weeks Short Term):   (Best to Buy these when the S&P 500 is also in the Green Zone.)       

The Following Investments will probably have a Money Wave Buy Signal soon. (Slow Stochastic Closing > 20) on today’s Close.            

CHWY      CHEWY INC.      Buy above $54.85 with a 5% Trailing Sell Stop Loss below it. 

DOCU      DOCUSIGN CORP.        Buy above $207.00 with a 3% Trailing Sell Stop Loss below it.   

HOME      AT HOME GROUP      Buy above the Pink Line of $15.45 with a 5% Trailing Sell Stop Loss below it. 

LOW      LOWES COMPANIES     Money Wave must Close in the Green Zone. 

SPWR      SUNPOWER CORP.

Please be patient and wait for Money Wave Buy Signals.  We will email you when they are ready. Follow on the WATCH LIST.

Emotions are very high now, so please do not Buy unless you are VERY NIMBLE.

The Leaders are Way Above the Green Lines (all Investments eventually return to their Green Lines).

____________________________________________________________________________________________________________

SELLS TODAY   

GDXJ     JUNIOR GOLD MINERS FUND     EXIT if it is going to Close below the Pink Line around $59.78.

SBSW     SIBANYE STILLWATER      LOWER the Sell Stop Loss below today’s Low $11.21. We got a “False Buy Signal” on Friday and SBSW is still in the Green Zone with a 91 Relative Strength.     

SLV      SILVER FUND      LOWER the Sell Stop Loss below $22.06 until it bottoms. 

Click for  CURRENT POSITIONS  and adjust your Sell Stops.   
Click for  CLOSED POSITIONS,   

NEW PENNY STOCK WATCH LIST
ARE YOUR INVESTMENTS ABOVE THE GREEN LINE?
ETF SECTOR ROTATION SYSTEM   
NEW TOP 100 LIST Updated Sep 2, 2020

Many like to Buy the day before, near the Close, if the Money Wave is going to create a Buy Signal (Closing > 20 and out of the Green Zone).

Don’t Buy if the Investment has already popped up too much. Money Wave Buys are usually good for a 3-6 %  move in a few days.

We will “Not Log” trades if the Reward/Risk is not at least 2:1.

Related Post

– Money Wave Alert! Sep 18, 2020

Subscribe to Our Newsletter

AGL Logo

Get our eBook Now!

Candlestick - A Swing Traders Friend

We don’t spam! Read our privacy policy for more info.

You’ve been successfully subscribed to our newsletter!

Voted #1 at Stock Charts

SH Chart
Inverse S&P 500 Fund (SH) will have a Money Wave Buy today.

Help Us Help Animals

Help Us Help Animals

Recent Comments

  • Market Breadth Indicators: A Trader’s Guide to Early Trend Detection on Backtesting: Definition and How a Trading Strategy Backtest Works
  • Island Reversal Pattern: Definition and Formation Explained on Double Top Pattern: How to Identify and Trade This Reversal Signal
  • Channel Pattern Guide: What It Is and Why It Matters on A Guide to Forecasting Using Moving Averages
  • What Is a Broadening Bottom Chart Pattern? Full Guide on Bull vs. Bear Market: An Investor’s Guide to Market Phases
  • ATGL Weekly Money Flow - 2025-05-11 on ATGL Top Pick of the Week! Apr 6, 2025

Become a Green Liner!

Help me make more Money in the Stock Market.

ON ATGL

  • DashBoard
  • Weekly Commentary
  • Daily Buy / Sell Signals
  • Day Trade Setup
  • Trading Rooms

Design & Develop By Pixelvect

STRATEGIES

  • Swing Trading
  • ATGL Pick of the Week
  • Dividend Growth
  • ETF Sector Rotation
  • Dogs of the Dow

HELP

  • ATGL Trading Rules
  • FAQ
  • Account Maintenance
  • Contact US
  • Join

FOLLOW US

Instagram Linkedin Twitter Facebook

© COPYRIGHT 2024 · ABOVETHEGREENLINE.COM · ALL RIGHTS RESERVED · PRIVACY · TERMS · CONTACT · WATCHLIST · CURRENT