
Watchlist and Charts to Buy Soon.
| Daily Swing Watch List | Daily Swing Charts to Buy |
| Current Swing Positions | Current Swing Charts |
| Closed Results | Trading Dashboard |
Current Pick and Chart
| Top Pick of the Week | TPOW Stock Chart |
Sep 18, 2025 Today the markets carried more bullish momentum, fueled by a dovish “magician squeeze,” with SPY pushing to a fresh higher high. At the same time, TLT Bonds declined as rising inflation and higher long-term rates pressured fixed-income assets, which tend to prefer slower inflation.
Herd sentiment stayed elevated on rate cuts, though such optimism risks creating a parabolic burst if liquidity cools. We also hit our CRWD weekly swing target after a strong surge, while this week’s TPOW position showed steady gains. Gold dipped slightly as the dollar strengthened, presenting a potential swing-buy setup for a retest of its highs, and overall, the day remained broadly bullish.
Wait for more Buy Signals coming up out of the Green Zones. WATCH LIST CHARTS
The best moves happen when the S&P 500 Index is also coming up out of the Green Zone.
______________________________________________________________________________
BUYS TODAY 9/18/2025 NONE TODAY
BUYS SOON
| Open Date | Symbol | Description | Industry | SCTR | Size | Last Price | Daily Change % | ATGL 60 Min | Comments | id | Strategy | Position | Sell Date | Sell Price | Purchase Price | Net Profit | Realized Gain/Loss % | ATGL Rule | Stop Loss | color | Chart | Update Date | Status | Unrealized Gain/Loss % | Volume | Post Type | # Shares | Amount Invested | Portfolio Weight | Dividend Rate | Current Yield | Current Value | Yield on Cost | Projected Annual Dividends | Total Dividends Received | Pay Back | Profit / Loss | Annualized Profit/Loss | Star Rating | Target Price | News Alert % | Target Triggered |
|---|---|---|---|---|---|---|---|---|---|---|---|---|---|---|---|---|---|---|---|---|---|---|---|---|---|---|---|---|---|---|---|---|---|---|---|---|---|---|---|---|---|---|
| 2026-03-26 | SNDK | Sandisk Corp. | Semiconductor | 99 | Large | $615.83 | 2.0989 | Wait for next Daily Money Wave Close > 20 with High Volume. | 5010 | Short Term | Long | $0.00 | 0.00% | https://stockcharts.com/sc3/ui/?s=SNDK&a=2116938080&p=D&yr=0&mn=6&dy=0&id=p30813991236 | 2026-03-26 15:35:08 | open | 0.00% | 16836810 | Watch List | $0 | 0.00% | 0.00 | 0 | $0 | 0.00% | $0 | $0 | 0.00% | 0.00% | - | $720.00 | |||||||||||
| 2026-03-26 | AMPX | Amprius Tech | Industrial | 94 | Small | $16.12 | -6.0606 | Wait for next Daily Money Wave Close > 20 with High Volume. | 5011 | Short Term | Long | $0.00 | 0.00% | https://stockcharts.com/sc3/ui/?s=AMPX&a=2015211659&p=D&yr=0&mn=4&dy=0&id=p23048837358 | 2026-03-26 22:49:11 | open | 0.00% | 6943610 | Watch List | $0 | 0.00% | 0.00 | 0 | $0 | 0.00% | $0 | $0 | 0.00% | 0.00% | - | $19.00 | |||||||||||
| 2026-03-24 | MU | Micron Tech. | Semiconductor | 98 | Large | $357.22 | 0.4951 | Wait for next Daily Money Wave Close > 20 with High Volume. | 5008 | Short Term | Long | $0.00 | 0.00% | https://stockcharts.com/sc3/ui/?s=MU&a=1659646208&p=D&yr=0&mn=4&dy=0&id=p30932029130 | 2026-03-24 16:38:04 | open | 0.00% | 46028972 | Watch List | $0 | 0.00% | 0.46 | 0.1288 | $0 | 0.00% | $0 | $0 | 0.00% | 0.00% | - | $450.00 |
Shop for a better price earlier in the day with Green Candle Buy Signal, on the same day that a Daily Money Wave Buy Signal will occur.
Many like to Buy the Swing Trades just before the Close, if the Money Wave is going to create a Buy Signal (Closing > 20 and up out of the Green Zone). Don’t Buy if the Security has already popped up too much. Money Wave Buy Signals are usually good for a 3-6 % move in a few days.
SELLS TODAY
BTI British Amer Tobacco Slipped down to the Buy Price and was Stopped Out even.
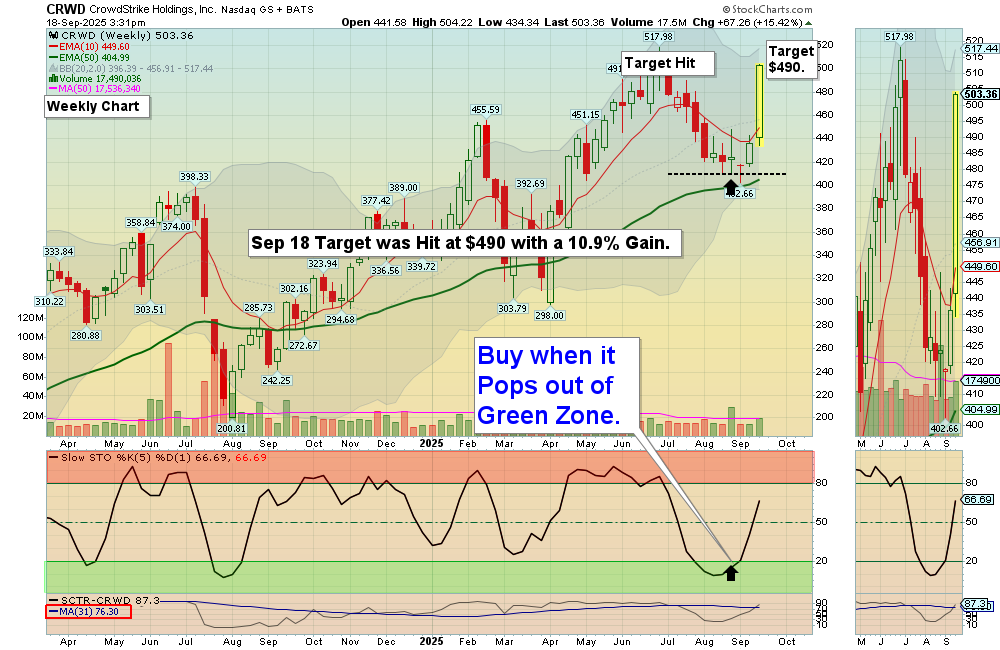
CRWD CrowdStrike Holdings Target was Hit at $490 with a 10.9% Gain.
SMR NuScale Power Sold at $40 via Trade Alert with a 10 % Gain.
________________________________________________________________________
WEEKLY GREEN ZONE POPS (Will Price these after Friday’s Close).
WEEKLY SWING TRADING (Formerly LONG TERM)Watchlist and Charts to Buy Soon.
| Weekly Swing Watch List | Weekly Swing Charts to Buy |
| Current Weekly Positions | Current Weekly Charts |
| Closed Results | Stage Chart Investing |
DAY TRADING SETUPS. Today we had 23 scalp trades for nice Gains at our Trading Room. In this Emotional Market now, Day Trading Alerts are not being sent out on our Discord Site with Live Chatting. Please install Discord app on your PC or cell for mobile notifications. Check out our Live Stream.
Or look for Green Candle Buy Pops (Red Candle turns Green). Big Movers today: CRWD+12% OKLO +15% & QBTS +9%
Bonds were down today and are Above the Green Line.
Crude Oil was down $0.33 today at $63.37.
MY TRADING DASHBOARD
SWING TRADING CURRENT POSITIONS
DAY TRADING SETUPS
TRADE ALERTS
STAGE CHART INVESTING
PREVIOUS GREEN LINE STOCKS