
Watchlist and Charts to Buy Soon.
| Daily Swing Watch List | Daily Swing Charts to Buy |
| Current Swing Positions | Current Swing Charts |
| Closed Results | Trading Dashboard |
Current Pick and Chart
| Top Pick of the Week | TPOW Stock Chart |
Oct 21, 2025 Today, the markets opened with mixed moves, showing some downside early, but SPY later retraced back up while QQQ held near previous highs, appearing to be in the final leg up for a potential M pattern. TLT bonds gapped up and made a higher high with a wide spread from the banana line, signaling economic weakness as bonds strengthen.
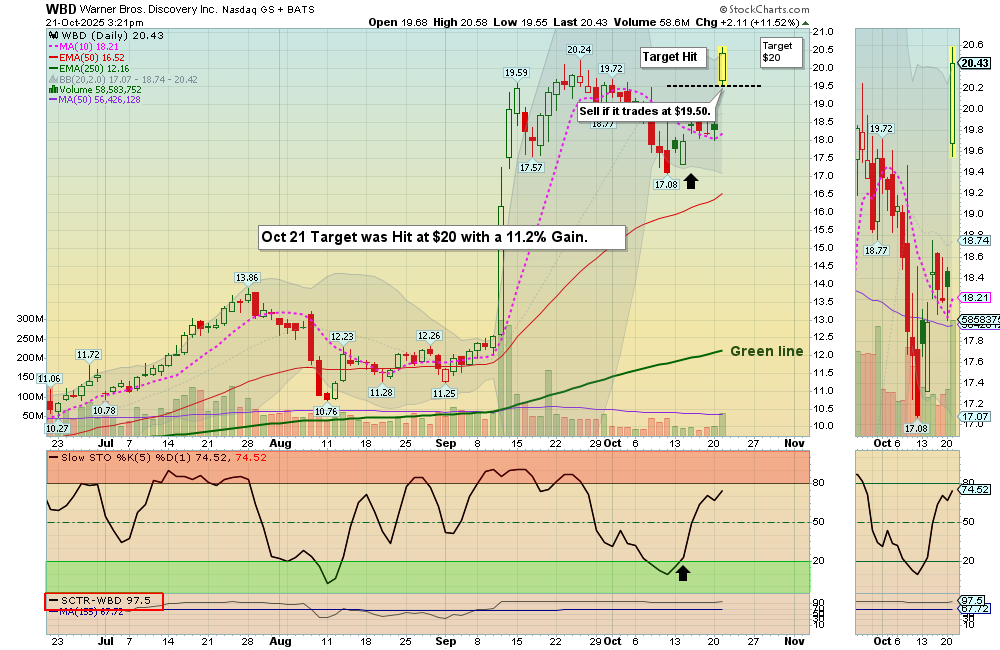
Gold miners flushed down to the banana line without forming an M pattern, but we expect a bounce soon to retest previous highs and possibly form a double top. The greed index SVXY met the banana line, suggesting that market sentiment is back to fair value. Warner Bros. ($WBD) hit its $20 target for a solid 11.2% gain, while we took our daily swing buy on KTOS. Overall, it was a slow-paced but steady trading day.
Wait for more Buy Signals coming up out of the Green Zones. WATCH LIST CHARTS
The best moves happen when the S&P 500 Index is also coming up out of the Green Zone.
______________________________________________________________________________
BUYS TODAY 10/21/2025
KTOS Kratos Defense & Security Solutions. Swing Trade Buy on the Close, but it is already up 4 % (2 Star trade).
BUYS SOON
| Open Date | Symbol | Description | Industry | SCTR | Size | Last Price | Daily Change % | Comments | ATGL 60 Min | id | Strategy | Position | Sell Date | Sell Price | Purchase Price | Net Profit | Realized Gain/Loss % | ATGL Rule | Stop Loss | color | Chart | Update Date | Status | Unrealized Gain/Loss % | Volume | Post Type | # Shares | Amount Invested | Portfolio Weight | Dividend Rate | Current Yield | Current Value | Yield on Cost | Projected Annual Dividends | Total Dividends Received | Pay Back | Profit / Loss | Annualized Profit/Loss | Star Rating | Target Price | News Alert % | Target Triggered |
|---|---|---|---|---|---|---|---|---|---|---|---|---|---|---|---|---|---|---|---|---|---|---|---|---|---|---|---|---|---|---|---|---|---|---|---|---|---|---|---|---|---|---|
| 2026-03-26 | SNDK | Sandisk Corp. | Semiconductor | 99 | Large | $615.83 | 2.0989 | Wait for next Daily Money Wave Close > 20 with High Volume. | 5010 | Short Term | Long | $0.00 | 0.00% | https://stockcharts.com/sc3/ui/?s=SNDK&a=2116938080&p=D&yr=0&mn=6&dy=0&id=p30813991236 | 2026-03-26 15:35:08 | open | 0.00% | 16836810 | Watch List | $0 | 0.00% | 0.00 | 0 | $0 | 0.00% | $0 | $0 | 0.00% | 0.00% | - | $720.00 | |||||||||||
| 2026-03-26 | AMPX | Amprius Tech | Industrial | 94 | Small | $16.12 | -6.0606 | Wait for next Daily Money Wave Close > 20 with High Volume. | 5011 | Short Term | Long | $0.00 | 0.00% | https://stockcharts.com/sc3/ui/?s=AMPX&a=2015211659&p=D&yr=0&mn=4&dy=0&id=p23048837358 | 2026-03-26 22:49:11 | open | 0.00% | 6943610 | Watch List | $0 | 0.00% | 0.00 | 0 | $0 | 0.00% | $0 | $0 | 0.00% | 0.00% | - | $19.00 | |||||||||||
| 2026-03-24 | MU | Micron Tech. | Semiconductor | 98 | Large | $357.22 | 0.4951 | Wait for next Daily Money Wave Close > 20 with High Volume. | 5008 | Short Term | Long | $0.00 | 0.00% | https://stockcharts.com/sc3/ui/?s=MU&a=1659646208&p=D&yr=0&mn=4&dy=0&id=p30932029130 | 2026-03-24 16:38:04 | open | 0.00% | 46028972 | Watch List | $0 | 0.00% | 0.46 | 0.1288 | $0 | 0.00% | $0 | $0 | 0.00% | 0.00% | - | $450.00 |
Shop for a better price earlier in the day with Green Candle Buy Signal, on the same day that a Daily Money Wave Buy Signal will occur.
Many like to Buy the Swing Trades just before the Close, if the Money Wave is going to create a Buy Signal (Closing > 20 and up out of the Green Zone). Don’t Buy if the Security has already popped up too much. Money Wave Buy Signals are usually good for a 3-6 % move in a few days.
SELLS TODAY
WBD Warner Bros Discovery. Target was hit at $20, securing a 11.2% gain after big pop today.
________________________________________________________________________
WEEKLY SWING TRADE POPS
SRAD Sportradar Group Weekly Swing Trade Buy today. Target is $30.
WEEKLY SWING TRADING (Formerly LONG TERM)Watchlist and Charts to Buy Soon.
| Weekly Swing Watch List | Weekly Swing Charts to Buy |
| Current Weekly Positions | Current Weekly Charts |
| Closed Results | Stage Chart Investing |
DAY TRADING SETUPS. Today we had 16 scalp trades for nice Gains at our Trading Room. In this Emotional Market now, Day Trading Alerts are not being sent out on our Discord Site with Live Chatting. Please install Discord app on your PC or cell for mobile notifications. Check out our Live Stream.
Or look for Green Candle Buy Pops (Red Candle turns Green). Big Movers today: CVNA+5% RR +5.5% & WBD +11%
Bonds were down today and are Above the Green Line.
Crude Oil was down $0.20 today at $56.87.
MY TRADING DASHBOARD
SWING TRADING CURRENT POSITIONS
DAY TRADING SETUPS
TRADE ALERTS
STAGE CHART INVESTING
PREVIOUS GREEN LINE STOCKS