Above the Green Line -01
  • Market Insights
        • Commentary
          • Daily
          • Weekly
        • BUY / SELL SIGNALS
          • Trade Posts
          • Recent Trade Alerts
          • Recent Day Trades
        • BLOGROLL
          • Dividend Growth Blog
          • ETF Sector Blog
          • Dow Dogs
          • TPOW Blog
  • Strategies
        • SWING TRADING
          • Current Positions
          • Watchlists
          • Closed Positions
          • Candidates - TOP 100
          • Specialty Stocks
        • WEEKLY STOCK PICK
          • TPOW Charts
          • TPOW Performance
          • TPOW Strategy Guide
          • TPOW Performance Dashboard
        • DAY TRADING
          • Watch List
        • ATGL DASHBOARD
        • ETF STRATEGIES
          • ETF Sector Rotation
          • ETF Sector Portfolio
        • DIVIDEND GROWTH
          • Dividend Growth Portfolio
          • Dividend Calendar
        • DOGS OF THE DOW
          • Dogs of the Dow Portfolio
          • DOW 5 Portfolio
  • Markets
        • US MARKET
          • Commodities
          • Energy
          • Precious Metals
          • Volatility
        • GLOBAL MARKETS
          • Market Indices
          • Economic Calendar
          • FOREX Heat Map
          • FOREX Cross Rates
          • Crypto Currency Market
  • Investing
    • Discord Community
    • Dashboard
  • Resources
        • ARTICLES
          • Dividend Growth Model Articles
          • ETF Articles
          • Investment Strategies Articles
          • Market and Economic Insights
          • Stock Trade Articles
          • Stock Reviews
        • TOOLS
          • Stock Scanners
          • Charting Software
          • Brokerage Firms
        • STOCK CHARTS
          • Key Components
          • Reading Charts
          • Drawing Stock Charts
          • Identifying Trends
        • RETIREMENT PLANNING
  • About
    • Contact Us
    • How to Win
    • #1 At Stockcharts
    • Disclaimer
    • FAQ
  • Log In
  • Subscribe

October 19, 2021

Money Wave Alert! Oct 19, 2021

SPY Chart
The S&P 500 Index is almost back up to the Highs.

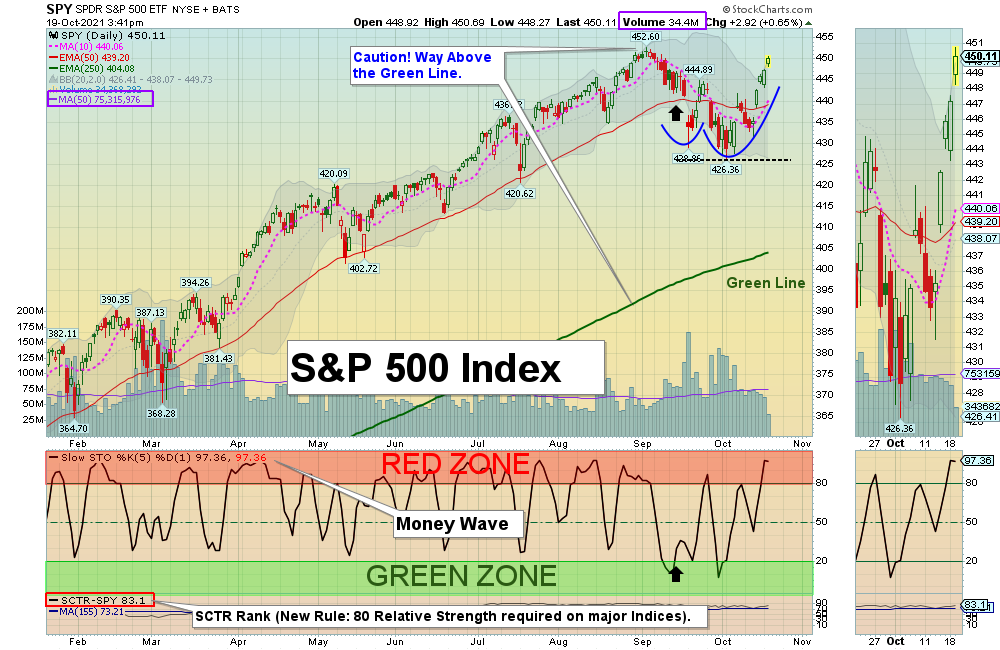
Markets were higher again today as the Indices are now getting close to the recent Highs. Now the Indices must continue to make Higher Highs for the rally that began in March 2020 to continue. Normally there would be some Selling at the Resistance of the previous Highs, and many of the Leaders are back up in the Red Zones (probably too late to Buy for the Short Term). 

There are several Money Wave Buys today (see below), but the Volume is low on all. We don’t want to Buy with the Markets back up near the Highs.

New Investors:  Leaders are back up in the Red Zones. Please WAIT for the Leaders to correct back down into the Green Zones for more Money Wave Buys. It does not take that long. The better trades happen when the S&P 500 Index is in the Green Zone.  

Triple Buys today for CEI (+25%) GSAT (+5%) IRNT (+12%) LPTX (+6%) & UNG. Soon for ANY BTBT DATS JSPR & OCGN in DAY TRADING SETUPS. 

Bonds  were up today, but are Below the Green Line.

Crude Oil was up $0.39 today at $82.83, a New High.

BUYS TODAY    10/19/2021    

CKR      COMSTOCK RESOURCES INC.    Money Wave Buy today, but CRK will not be bought or logged as the Volume is below average of 3.7 MIL.

CTRA      COTERRA ENERGY INC.      Money Wave Buy today, but CTRA will not be bought or logged as the Volume is below average of 13.3 MIL.  

SB      SAFE BULKERS INC.     Money Wave Buy today, but SB will not be bought or logged as the Volume is below average of 1.9 MIL.    

We will “Not Log” trades if the Reward/Risk is not at least 2:1, or Low Volume. These have more risk.   

_________________________________________________________________________________________________

JUMP START SCROLLING CHARTS: (Buy Signal should be very soon… Click on the Jump Start link for more info.)      

LPTX      LEAP THERA.      Wait for Money Wave Close > 20 with High Volume.    

_________________________________________________________________________________________________

WATCH LIST (Click here)       

WATCH LIST SCROLLING CHARTS (Real Time)

EVH      EVOLENT HEALTH INC.        Buy above the $30.90 with High Volume with a 5% Trailing Sell Stop Loss below it.

MRIN      MARIN SOFTWARE INC.     Buy above the $8.60 with High Volume with a 5% Trailing Sell Stop Loss below it.

Please be patient and wait for Money Wave Buy Signals.  We will email you when they are ready. Follow on the WATCH LIST.      
Emotions are very high now, so please do not Buy unless you are VERY NIMBLE.

The Leaders are Way Above the Green Lines (all Investments eventually return to their Green Lines).      

____________________________________________________________________________________________________________

SELLS TODAY     NONE TODAY              

Click for  CURRENT POSITION SCROLLING CHARTS – Real Time  (Please check and adjust your Sell Stops).    

Click for  CLOSED POSITIONS,   
NEW:       MY TRADING DASHBOARD
DAY TRADING SETUPS
NEW:  TRADE ALERTS
ARE YOUR INVESTMENTS ABOVE THE GREEN LINE?
ETF SECTOR ROTATION SYSTEM   
New TOP 100 LIST Updated Oct 1, 2021

Many like to Buy the day before, near the Close, if the Money Wave is going to create a Buy Signal (Closing > 20 and out of the Green Zone).

Don’t Buy if the Investment has already popped up too much. Money Wave Buys are usually good for a 3-6 %  move in a few days.

We will “Not Log” trades if the Reward/Risk is not at least 2:1, or Low Volume. These have more risk.   

Related Post

– Money Wave Alert Oct 18, 2021

Subscribe to Our Newsletter

AGL Logo

Get our eBook Now!

Candlestick - A Swing Traders Friend

We don’t spam! Read our privacy policy for more info.

You’ve been successfully subscribed to our newsletter!

Voted #1 at Stock Charts

SH Chart
Inverse S&P 500 Fund (SH) will have a Money Wave Buy today.

Help Us Help Animals

Help Us Help Animals

Recent Comments

  • Market Breadth Indicators: A Trader’s Guide to Early Trend Detection on Backtesting: Definition and How a Trading Strategy Backtest Works
  • Island Reversal Pattern: Definition and Formation Explained on Double Top Pattern: How to Identify and Trade This Reversal Signal
  • Channel Pattern Guide: What It Is and Why It Matters on A Guide to Forecasting Using Moving Averages
  • What Is a Broadening Bottom Chart Pattern? Full Guide on Bull vs. Bear Market: An Investor’s Guide to Market Phases
  • ATGL Weekly Money Flow - 2025-05-11 on ATGL Top Pick of the Week! Apr 6, 2025

Become a Green Liner!

Help me make more Money in the Stock Market.

ON ATGL

  • DashBoard
  • Weekly Commentary
  • Daily Buy / Sell Signals
  • Day Trade Setup
  • Trading Rooms

Design & Develop By Pixelvect

STRATEGIES

  • Swing Trading
  • ATGL Pick of the Week
  • Dividend Growth
  • ETF Sector Rotation
  • Dogs of the Dow

HELP

  • ATGL Trading Rules
  • FAQ
  • Account Maintenance
  • Contact US
  • Join

FOLLOW US

Instagram Linkedin Twitter Facebook

© COPYRIGHT 2024 · ABOVETHEGREENLINE.COM · ALL RIGHTS RESERVED · PRIVACY · TERMS · CONTACT · WATCHLIST · CURRENT