
Watchlist and Charts to Buy Soon.
| Daily Swing Watch List | Daily Swing Charts to Buy |
| Current Swing Positions | Current Swing Charts |
| Closed Results | Trading Dashboard |
Current Pick and Chart
| Top Pick of the Week | TPOW Stock Chart |
Oct 16, 2025 Today, the markets opened on a positive note with SPY gapping slightly higher and moving up initially, but soon retracing back into the previous day’s range and lows. The SVXY greed index dropped sharply while the UVXY fear index pushed higher, showing that market sentiment leaned more toward fear. However, prices and sentiment eventually tend to meet at the banana line—the true equilibrium of value.
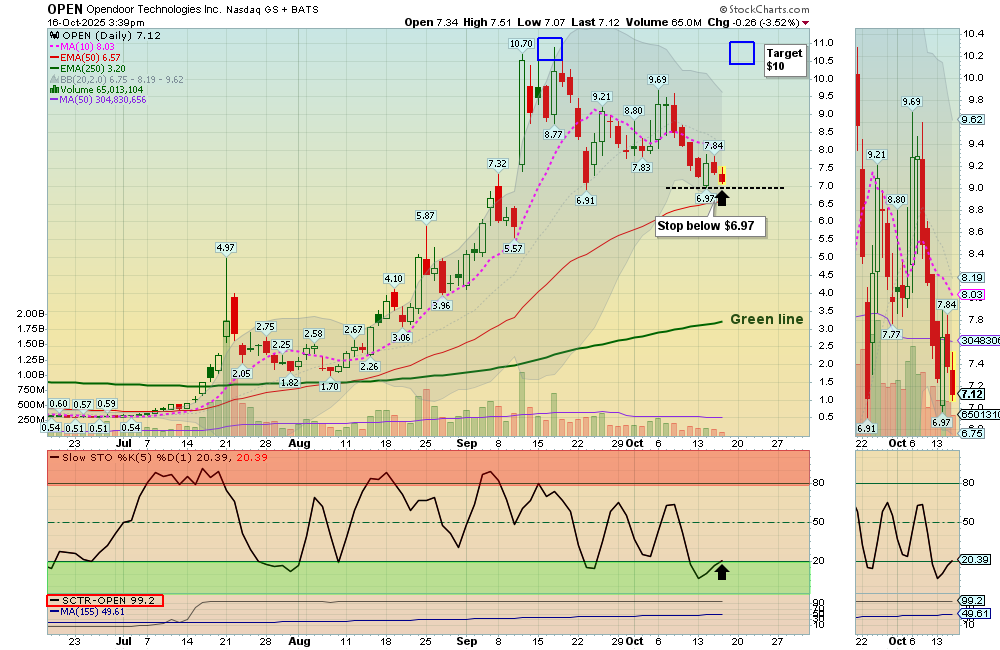
Many major leaders dipped today, including crypto-related funds like Ethereum Fund (ETHA), while NVTS stood out as one of the strongest stocks with solid volume and SCTR. Gold miners and the biotech ETF XBI also showed strength, and we took a daily Swing Buy at the close on OPEN, overall the day remained weak with limited volatility.
Wait for more Buy Signals coming up out of the Green Zones. WATCH LIST CHARTS
The best moves happen when the S&P 500 Index is also coming up out of the Green Zone.
______________________________________________________________________________
BUYS TODAY 10/16/2025
OPEN Opendoor Technologies Inc. Swing Trade Buy on the Close, but the volume is not high (2 Star trade).
BUYS SOON
| Open Date | Symbol | Description | Industry | SCTR | Size | Last Price | Daily Change % | Comments | ATGL 60 Min | id | Strategy | Position | Sell Date | Sell Price | Purchase Price | Net Profit | Realized Gain/Loss % | ATGL Rule | Stop Loss | color | Chart | Update Date | Status | Unrealized Gain/Loss % | Volume | Post Type | # Shares | Amount Invested | Portfolio Weight | Dividend Rate | Current Yield | Current Value | Yield on Cost | Projected Annual Dividends | Total Dividends Received | Pay Back | Profit / Loss | Annualized Profit/Loss | Star Rating | Target Price | News Alert % | Target Triggered |
|---|---|---|---|---|---|---|---|---|---|---|---|---|---|---|---|---|---|---|---|---|---|---|---|---|---|---|---|---|---|---|---|---|---|---|---|---|---|---|---|---|---|---|
| 2026-03-26 | SNDK | Sandisk Corp. | Semiconductor | 99 | Large | $615.83 | 2.0989 | Wait for next Daily Money Wave Close > 20 with High Volume. | 5010 | Short Term | Long | $0.00 | 0.00% | https://stockcharts.com/sc3/ui/?s=SNDK&a=2116938080&p=D&yr=0&mn=6&dy=0&id=p30813991236 | 2026-03-26 15:35:08 | open | 0.00% | 16836810 | Watch List | $0 | 0.00% | 0.00 | 0 | $0 | 0.00% | $0 | $0 | 0.00% | 0.00% | - | $720.00 | |||||||||||
| 2026-03-26 | AMPX | Amprius Tech | Industrial | 94 | Small | $16.12 | -6.0606 | Wait for next Daily Money Wave Close > 20 with High Volume. | 5011 | Short Term | Long | $0.00 | 0.00% | https://stockcharts.com/sc3/ui/?s=AMPX&a=2015211659&p=D&yr=0&mn=4&dy=0&id=p23048837358 | 2026-03-26 22:49:11 | open | 0.00% | 6943610 | Watch List | $0 | 0.00% | 0.00 | 0 | $0 | 0.00% | $0 | $0 | 0.00% | 0.00% | - | $19.00 | |||||||||||
| 2026-03-24 | MU | Micron Tech. | Semiconductor | 98 | Large | $357.22 | 0.4951 | Wait for next Daily Money Wave Close > 20 with High Volume. | 5008 | Short Term | Long | $0.00 | 0.00% | https://stockcharts.com/sc3/ui/?s=MU&a=1659646208&p=D&yr=0&mn=4&dy=0&id=p30932029130 | 2026-03-24 16:38:04 | open | 0.00% | 46028972 | Watch List | $0 | 0.00% | 0.46 | 0.1288 | $0 | 0.00% | $0 | $0 | 0.00% | 0.00% | - | $450.00 |
Shop for a better price earlier in the day with Green Candle Buy Signal, on the same day that a Daily Money Wave Buy Signal will occur.
Many like to Buy the Swing Trades just before the Close, if the Money Wave is going to create a Buy Signal (Closing > 20 and up out of the Green Zone). Don’t Buy if the Security has already popped up too much. Money Wave Buy Signals are usually good for a 3-6 % move in a few days.
SELLS TODAY NONE TODAY
________________________________________________________________________
WEEKLY SWING TRADE POPS None Today
WEEKLY SWING TRADING (Formerly LONG TERM)Watchlist and Charts to Buy Soon.
| Weekly Swing Watch List | Weekly Swing Charts to Buy |
| Current Weekly Positions | Current Weekly Charts |
| Closed Results | Stage Chart Investing |
DAY TRADING SETUPS. Today we had 22 scalp trades for nice Gains at our Trading Room. In this Emotional Market now, Day Trading Alerts are not being sent out on our Discord Site with Live Chatting. Please install Discord app on your PC or cell for mobile notifications. Check out our Live Stream.
Or look for Green Candle Buy Pops (Red Candle turns Green). Big Movers today: GDXU+9% VXX +10% & SMR+10%
Bonds were up today and are Above the Green Line.
Crude Oil was down $0.82 today at $57.45.
MY TRADING DASHBOARD
SWING TRADING CURRENT POSITIONS
DAY TRADING SETUPS
TRADE ALERTS
STAGE CHART INVESTING
PREVIOUS GREEN LINE STOCKS