Above the Green Line -01
  • Market Insights
        • Commentary
          • Daily
          • Weekly
        • BUY / SELL SIGNALS
          • Trade Posts
          • Recent Trade Alerts
          • Recent Day Trades
        • BLOGROLL
          • Dividend Growth Blog
          • ETF Sector Blog
          • Dow Dogs
          • TPOW Blog
  • Strategies
        • SWING TRADING
          • Current Positions
          • Watchlists
          • Closed Positions
          • Candidates - TOP 100
          • Specialty Stocks
        • WEEKLY STOCK PICK
          • TPOW Charts
          • TPOW Performance
          • TPOW Strategy Guide
          • TPOW Performance Dashboard
        • DAY TRADING
          • Watch List
        • ATGL DASHBOARD
        • ETF STRATEGIES
          • ETF Sector Rotation
          • ETF Sector Portfolio
        • DIVIDEND GROWTH
          • Dividend Growth Portfolio
          • Dividend Calendar
        • DOGS OF THE DOW
          • Dogs of the Dow Portfolio
          • DOW 5 Portfolio
  • Markets
        • US MARKET
          • Commodities
          • Energy
          • Precious Metals
          • Volatility
        • GLOBAL MARKETS
          • Market Indices
          • Economic Calendar
          • FOREX Heat Map
          • FOREX Cross Rates
          • Crypto Currency Market
  • Investing
    • Discord Community
    • Dashboard
  • Resources
        • ARTICLES
          • Dividend Growth Model Articles
          • ETF Articles
          • Investment Strategies Articles
          • Market and Economic Insights
          • Stock Trade Articles
          • Stock Reviews
        • TOOLS
          • Stock Scanners
          • Charting Software
          • Brokerage Firms
        • STOCK CHARTS
          • Key Components
          • Reading Charts
          • Drawing Stock Charts
          • Identifying Trends
        • RETIREMENT PLANNING
  • About
    • Contact Us
    • How to Win
    • #1 At Stockcharts
    • Disclaimer
    • FAQ
  • Log In
  • Subscribe

October 11, 2024

Money Wave Alert! Oct 11, 2024

QQQ chart
The NASDAQ 100 Fund is still not back up to the July highs ($QQQ).

SWING TRADING (SHORT TERM)
Watchlist and Charts

Watch ListWatch List Charts
Current PositionsCurrent Charts
Closed ResultsTrading Dashboard

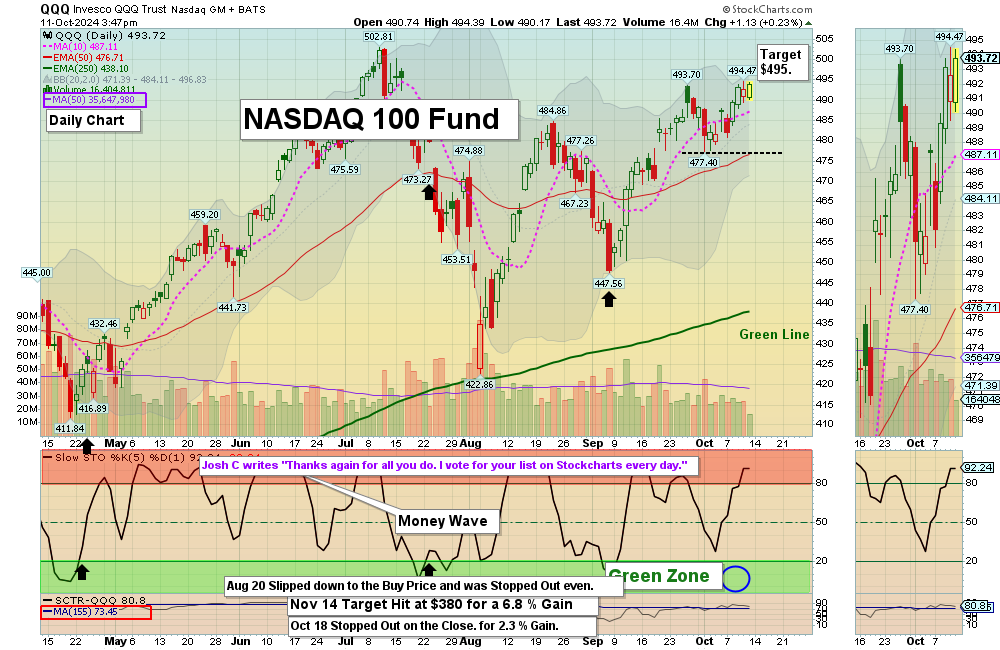
10/11/0/2024  The Markets were higher today on continued low buying Volume. The S&P 500  & DOW 30 Indices were was able to make a higher highs today, but the other major Indices are lagging. The FEAR is quickly gone again, and the Greed Index has been stronger the last few days. The S&P 500 has important Support at 565.

Bonds have not bounced up yet from the Green Line. Long term Interest Rates have risen from 3.9 % to 4.4%,

Wait for more Buy Signals coming up out of the Green Zones.  CHARTS  The best moves happen when the S&P 500 Index is also coming up out of the Green Zone. 

______________________________________________________________________________

NEW! TOP PICK OF THE WEEK!  Please Sell on the Close today for a nice weekly Gain.

______________________________________________________________________________

BUYS TODAY   10/11/2024     

COMP      COMPASS INC.          Swing Trade Buy on the Close, and the Volume not high (2 Star trade).

ZIM      ZIM SHIPPING       Swing Trade Buy on the Close, but it is already up 5.5 % today (2 Star trade).

BUYS TOMORROW     

FXI       CHINA FUND        Wait for Daily Money Wave Close > 20 with High Volume. 

TIGR      UP FINTECH HOLDING      Wait for Daily Money Wave Close > 20 with High Volume.     

XLU      UTILITIES FUND      Wait for Daily Money Wave Close > 20 with High Volume. 

Shop for a better price earlier in the day with Triple Buy Signal, on the same day that a Daily Money Wave Buy Signal will occur.        

BUYS SOON        

APLD      APPLIED DIGITAL      Money Wave Must Close in the Green Zone.

VST      VISTRA ENERGY        Money Wave Must Close in the Green Zone.  

Please be patient and Wait for Money Wave Buy Signals.  We will email you when they are ready. Follow on the WATCH LIST.     

Many like to Buy the Swing Trades just before the Close, if the Money Wave is going to create a Buy Signal (Closing > 20 and up out of the Green Zone). Don’t Buy if the Security has already popped up too much. Money Wave Buy Signals are usually good for a 3-6 % move in a few days.         

SELLS TODAY      NONE TODAY           

_______________________________________________________________________

DAY TRADING SETUPS.  Today we had 5 trades for $942 at our Trading Room. Day Trading Alerts are now being sent out on our Discord Site with Live Chatting. Please install Discord app on your PC or cell for mobile notifications.     

Or look for Triple Buy Pops (3 Green Circles). Big Movers today: CLSK +11%, MSTR +15%,  TSLQ +18%.   

NEW!   BANANA HUNT TRADING CHARTS.

Bonds were mixed today and are Above the Green Line.  
Crude Oil was down $0.35 today at $75.52.   

NEW! TOP PICK OF THE WEEK!

MY TRADING DASHBOARD 
SWING TRADING CURRENT POSITIONS
DAY TRADING SETUPS
TRADE ALERTS
STAGE CHART INVESTING
GREEN LINE CHARTS AT STOCKCHARTS
ARE YOUR INVESTMENTS ABOVE THE GREEN LINE?
GREEN LINE RULES
ETF SECTOR ROTATION SYSTEM
New TOP 100 LIST Updated Oct 1, 2024  

Important Links

Top 100Stage Chart InvestingCNN Fear & Greed Index
Dividend Growth PortfolioETF Sector PortfolioDogs of the Dow
Long Term StrategyStage Chart InvestingArticles

* Safer Trades that meet ALL three criteria will be classified as 3 STAR, while trades that only meet two of the three criteria will be flagged as 2 STAR (more risk).


HAVE A NICE WEEKEND!

Related Post

– COMP

Subscribe to Our Newsletter

AGL Logo

Get our eBook Now!

Candlestick - A Swing Traders Friend

We don’t spam! Read our privacy policy for more info.

You’ve been successfully subscribed to our newsletter!

Voted #1 at Stock Charts

SH Chart
Inverse S&P 500 Fund (SH) will have a Money Wave Buy today.

Help Us Help Animals

Help Us Help Animals

Recent Comments

  • ATGL Weekly Money Flow - 2025-07-13 on AGTL Top Pick of the Week! May 11, 2025
  • Market Breadth Indicators: A Trader’s Guide to Early Trend Detection on Backtesting: Definition and How a Trading Strategy Backtest Works
  • Island Reversal Pattern: Definition and Formation Explained on Double Top Pattern: How to Identify and Trade This Reversal Signal
  • Channel Pattern Guide: What It Is and Why It Matters on A Guide to Forecasting Using Moving Averages
  • What Is a Broadening Bottom Chart Pattern? Full Guide on Bull vs. Bear Market: An Investor’s Guide to Market Phases

Become a Green Liner!

Help me make more Money in the Stock Market.

ON ATGL

  • DashBoard
  • Weekly Commentary
  • Daily Buy / Sell Signals
  • Day Trade Setup
  • Trading Rooms

Design & Develop By Pixelvect

STRATEGIES

  • Swing Trading
  • ATGL Pick of the Week
  • Dividend Growth
  • ETF Sector Rotation
  • Dogs of the Dow

HELP

  • ATGL Trading Rules
  • FAQ
  • Account Maintenance
  • Contact US
  • Join

FOLLOW US

Instagram Linkedin Twitter Facebook

© COPYRIGHT 2024 · ABOVETHEGREENLINE.COM · ALL RIGHTS RESERVED · PRIVACY · TERMS · CONTACT · WATCHLIST · CURRENT