
Watchlist and Charts to Buy Soon.
| Daily Swing Watch List | Daily Swing Charts to Buy |
| Current Swing Positions | Current Swing Charts |
| Closed Results | Trading Dashboard |
Current Pick and Chart
| Top Pick of the Week | TPOW Stock Chart |
Oct 1, 2025 Today the markets opened on a slightly bullish note, with SPY continuing its move to the upside. Gold remained the strongest performer, alongside Bitcoin and Ethereum-related funds, which also popped higher, while small caps like IWM lagged behind compared to large caps.
LAC (Lithium Americas) emerged as one of the leading stocks with high-volume spikes, and silver also moved upward. The markets are being driven by money flow, with some bets on NVDA’s daily breakout, though volume does not fully support it.
Wait for more Buy Signals coming up out of the Green Zones. WATCH LIST CHARTS
The best moves happen when the S&P 500 Index is also coming up out of the Green Zone.
______________________________________________________________________________
BUYS TODAY 10/01/2025
ALAB Astera Labs. Swing Trade Buy on the Close, but the Volume is not High (2 Star trade).
OKLO Oklo Inc. Swing Trade Buy on the Close, but the Volume is not High (2 Star trade).
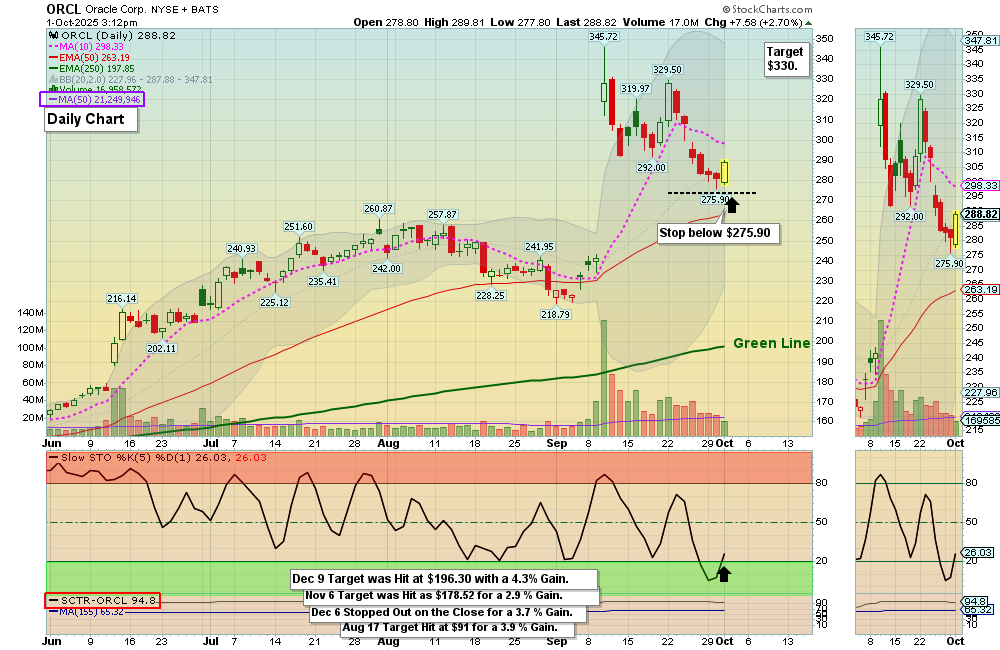
ORCL Oracle Corp. Swing Trade Buy on the Close, but the Volume is not High (2 Star trade).
RR Richtech Robotics. Swing Trade Buy on the Close, but it is already up 10% (Caution).
BUYS SOON
| Open Date | Symbol | Description | Industry | SCTR | Size | Last Price | Daily Change % | ATGL 60 Min | Comments | id | Strategy | Position | Sell Date | Sell Price | Purchase Price | Net Profit | Realized Gain/Loss % | ATGL Rule | Stop Loss | color | Chart | Update Date | Status | Unrealized Gain/Loss % | Volume | Post Type | # Shares | Amount Invested | Portfolio Weight | Dividend Rate | Current Yield | Current Value | Yield on Cost | Projected Annual Dividends | Total Dividends Received | Pay Back | Profit / Loss | Annualized Profit/Loss | Star Rating | Target Price | News Alert % | Target Triggered |
|---|---|---|---|---|---|---|---|---|---|---|---|---|---|---|---|---|---|---|---|---|---|---|---|---|---|---|---|---|---|---|---|---|---|---|---|---|---|---|---|---|---|---|
| 2026-03-26 | SNDK | Sandisk Corp. | Semiconductor | 99 | Large | $615.83 | 2.0989 | Wait for next Daily Money Wave Close > 20 with High Volume. | 5010 | Short Term | Long | $0.00 | 0.00% | https://stockcharts.com/sc3/ui/?s=SNDK&a=2116938080&p=D&yr=0&mn=6&dy=0&id=p30813991236 | 2026-03-26 15:35:08 | open | 0.00% | 16836810 | Watch List | $0 | 0.00% | 0.00 | 0 | $0 | 0.00% | $0 | $0 | 0.00% | 0.00% | - | $720.00 | |||||||||||
| 2026-03-26 | AMPX | Amprius Tech | Industrial | 94 | Small | $16.12 | -6.0606 | Wait for next Daily Money Wave Close > 20 with High Volume. | 5011 | Short Term | Long | $0.00 | 0.00% | https://stockcharts.com/sc3/ui/?s=AMPX&a=2015211659&p=D&yr=0&mn=4&dy=0&id=p23048837358 | 2026-03-26 22:49:11 | open | 0.00% | 6943610 | Watch List | $0 | 0.00% | 0.00 | 0 | $0 | 0.00% | $0 | $0 | 0.00% | 0.00% | - | $19.00 | |||||||||||
| 2026-03-24 | MU | Micron Tech. | Semiconductor | 98 | Large | $357.22 | 0.4951 | Wait for next Daily Money Wave Close > 20 with High Volume. | 5008 | Short Term | Long | $0.00 | 0.00% | https://stockcharts.com/sc3/ui/?s=MU&a=1659646208&p=D&yr=0&mn=4&dy=0&id=p30932029130 | 2026-03-24 16:38:04 | open | 0.00% | 46028972 | Watch List | $0 | 0.00% | 0.46 | 0.1288 | $0 | 0.00% | $0 | $0 | 0.00% | 0.00% | - | $450.00 |
Shop for a better price earlier in the day with Green Candle Buy Signal, on the same day that a Daily Money Wave Buy Signal will occur.
Many like to Buy the Swing Trades just before the Close, if the Money Wave is going to create a Buy Signal (Closing > 20 and up out of the Green Zone). Don’t Buy if the Security has already popped up too much. Money Wave Buy Signals are usually good for a 3-6 % move in a few days.
SELLS TODAY
CIFR Cipher Mining Slipped down to the Buy Price and was stopped out even.
________________________________________________________________________
WEEKLY GREEN ZONE POPS (Will Price these after Friday’s Close).
WEEKLY SWING TRADING (Formerly LONG TERM)Watchlist and Charts to Buy Soon.
| Weekly Swing Watch List | Weekly Swing Charts to Buy |
| Current Weekly Positions | Current Weekly Charts |
| Closed Results | Stage Chart Investing |
DAY TRADING SETUPS. Today we had 24 scalp trades for nice Gains at our Trading Room. In this Emotional Market now, Day Trading Alerts are not being sent out on our Discord Site with Live Chatting. Please install Discord app on your PC or cell for mobile notifications. Check out our Live Stream.
Or look for Green Candle Buy Pops (Red Candle turns Green). Big Movers today: QS+18% TMC +8% & RR +9%
Bonds were down today and are Above the Green Line.
Crude Oil was down $0.32 today at $62.05.
MY TRADING DASHBOARD
SWING TRADING CURRENT POSITIONS
DAY TRADING SETUPS
TRADE ALERTS
STAGE CHART INVESTING
PREVIOUS GREEN LINE STOCKS