
DAILY SWING TRADING (SHORT TERM)
Watchlist and Charts to Buy Soon.
Daily Swing Watch List Daily Swing Charts to Buy
Current Swing Positions Current Swing Charts
Closed Results Trading Dashboard
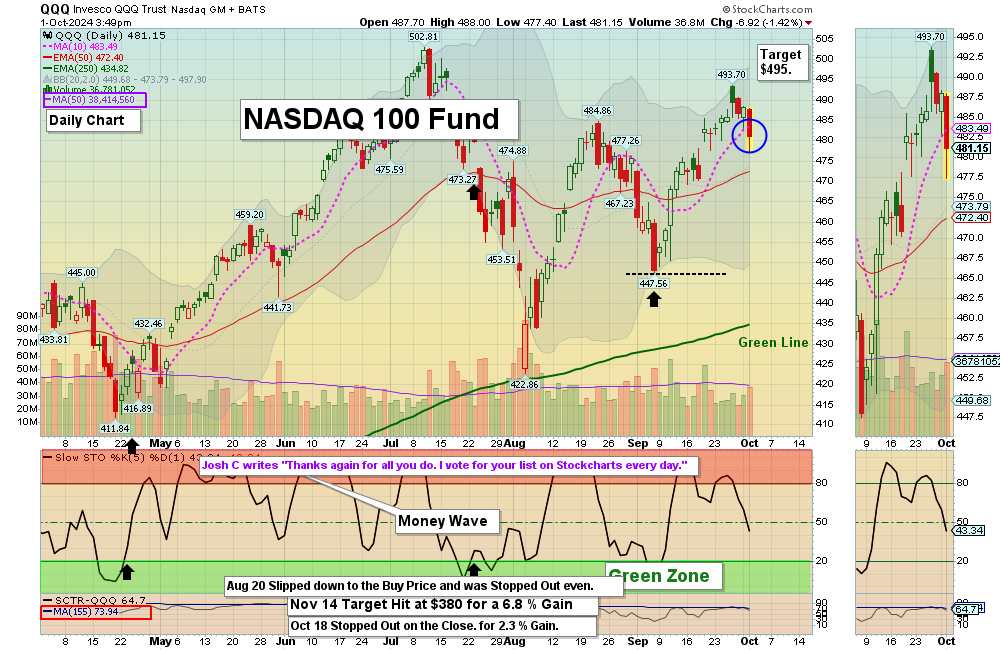
10/1/2024 The Markets were lower today after Bad News on the Economy. The S&P 500 & NASDAQ 100 Funds are struggling to stay above the Pink Lines (10=day avgs.) to avoid short term Sell Signals.
The Indices have not been able to go higher than last week. So far the Buying Volume is weak.
Wait for more Buy Signals coming up out of the Green Zones. CHARTS The best moves happen when the S&P 500 Index is also coming up out of the Green Zone.
______________________________________________________________________________
ETF SECTOR ROTATION SYSTEM The 4th Quarter began today, Oct 1st, and we will Buy all 5 ETF Positions on the Close. The 5 new ETFs to Buy today Oct 1st will be SPY – S&P 500 Fund, QQQ – NASDAQ 100 Fund, SLV – Silver Trust Fund, XLF – Financial Fund, and GDX – Gold Mining Fund and should be bought on the Close. Or you can replace XLE with GDX and have 20% allocated evenly in each Fund for the monthly rotation.
______________________________________________________________________________
BUYS TODAY 10/1/2024
Z ZILLOW GROUP Money Wave Buy Signal today, the Volume is not high (2 Star trade).
BUYS TOMORROW
CLOV CLOVER HEALTH Wait for Daily Money Wave Close > 20 with High Volume.
NGD NEW GOLD INC. Wait for Daily Money Wave Close > 20 with High Volume.
PCT PURECYCLE TECH Wait for Daily Money Wave Close > 20 with High Volume.
Shop for a better price earlier in the day with Triple Buy Signal, on the same day that a Daily Money Wave Buy Signal will occur.
BUYS SOON
ABUS ARBUTUS BIOPHARMA Relative Strength is Below 90. Avoid.
KKR KKR & CO. Money Wave Must Close in the Green Zone.
Please be patient and Wait for Money Wave Buy Signals. We will email you when they are ready. Follow on the WATCH LIST.
Many like to Buy the Swing Trades just before the Close, if the Money Wave is going to create a Buy Signal (Closing > 20 and up out of the Green Zone). Don’t Buy if the Security has already popped up too much. Money Wave Buy Signals are usually good for a 3-6 % move in a few days.
SELLS TODAY
NVDA NVIDIA CORP. EXIT if it is going to Close below the Pink Line around $119.19.
PBI PITNEY BOWES EXIT if it is going to Close below the Pink Line around $7.06. The Target was already Hit at $36 for a 25.6 % Gain.
PLTR PALANTIR CORP. EXIT if it is going to Close below the Pink Line around $37.03. The Target was already Hit at $32.75 for a 5.6 % Gain.
SG SWEETGREEN INC. EXIT if it is going to Close below the Pink Line around $35.66. The Target was already Hit at $36 for a 25.6 % Gain.
SPY S&P 500 FUND EXIT if it is going to Close below the Pink Line around $569.55. The Target was already Hit at $560 for a 2 % Gain.
_______________________________________________________________________
DAY TRADING SETUPS. Today we had 12 trades for $2,120 at our Trading Room. Day Trading Alerts are now being sent out on our Discord Site with Live Chatting. Please install Discord app on your PC or cell for mobile notifications.
Or look for Triple Buy Pops (3 Green Circles). Big Movers today: UVXY +10%, GDS +9%, SOXS +9%.
NEW! BANANA HUNT TRADING CHARTS.
Bonds were up today and are Above the Green Line.
Crude Oil was up $1.97 today at $70.13.
MY TRADING DASHBOARD
SWING TRADING CURRENT POSITIONS
DAY TRADING SETUPS
TRADE ALERTS
STAGE CHART INVESTING
GREEN LINE CHARTS AT STOCKCHARTS
ARE YOUR INVESTMENTS ABOVE THE GREEN LINE?
GREEN LINE RULES
ETF SECTOR ROTATION SYSTEM
New TOP 100 LIST Updated Oct 1, 2024
Important Links
Top 100 Stage Chart Investing CNN Fear & Greed Index
Dividend Growth Portfolio ETF Sector Portfolio Dogs of the Dow
Long Term Strategy Stage Chart Investing Articles
* Safer Trades that meet ALL three criteria will be classified as 3 STAR, while trades that only meet two of the three criteria will be flagged as 2 STAR (more risk).
Related Post
– Z