Above the Green Line -01
  • Market Insights
        • Commentary
          • Daily
          • Weekly
        • BUY / SELL SIGNALS
          • Trade Posts
          • Recent Trade Alerts
          • Recent Day Trades
        • BLOGROLL
          • Dividend Growth Blog
          • ETF Sector Blog
          • Dow Dogs
          • TPOW Blog
  • Strategies
        • SWING TRADING
          • Current Positions
          • Watchlists
          • Closed Positions
          • Candidates - TOP 100
          • Specialty Stocks
        • WEEKLY STOCK PICK
          • TPOW Charts
          • TPOW Performance
          • TPOW Strategy Guide
          • TPOW Performance Dashboard
        • DAY TRADING
          • Watch List
        • ATGL DASHBOARD
        • ETF STRATEGIES
          • ETF Sector Rotation
          • ETF Sector Portfolio
        • DIVIDEND GROWTH
          • Dividend Growth Portfolio
          • Dividend Calendar
        • DOGS OF THE DOW
          • Dogs of the Dow Portfolio
          • DOW 5 Portfolio
  • Markets
        • US MARKET
          • Commodities
          • Energy
          • Precious Metals
          • Volatility
        • GLOBAL MARKETS
          • Market Indices
          • Economic Calendar
          • FOREX Heat Map
          • FOREX Cross Rates
          • Crypto Currency Market
  • Investing
    • Discord Community
    • Dashboard
  • Resources
        • ARTICLES
          • Dividend Growth Model Articles
          • ETF Articles
          • Investment Strategies Articles
          • Market and Economic Insights
          • Stock Trade Articles
          • Stock Reviews
        • TOOLS
          • Stock Scanners
          • Charting Software
          • Brokerage Firms
        • STOCK CHARTS
          • Key Components
          • Reading Charts
          • Drawing Stock Charts
          • Identifying Trends
        • RETIREMENT PLANNING
  • About
    • Contact Us
    • How to Win
    • #1 At Stockcharts
    • Disclaimer
    • FAQ
  • Log In
  • Subscribe

March 9, 2017

Money Wave Alert! Mar 9, 2017

Oil Chart

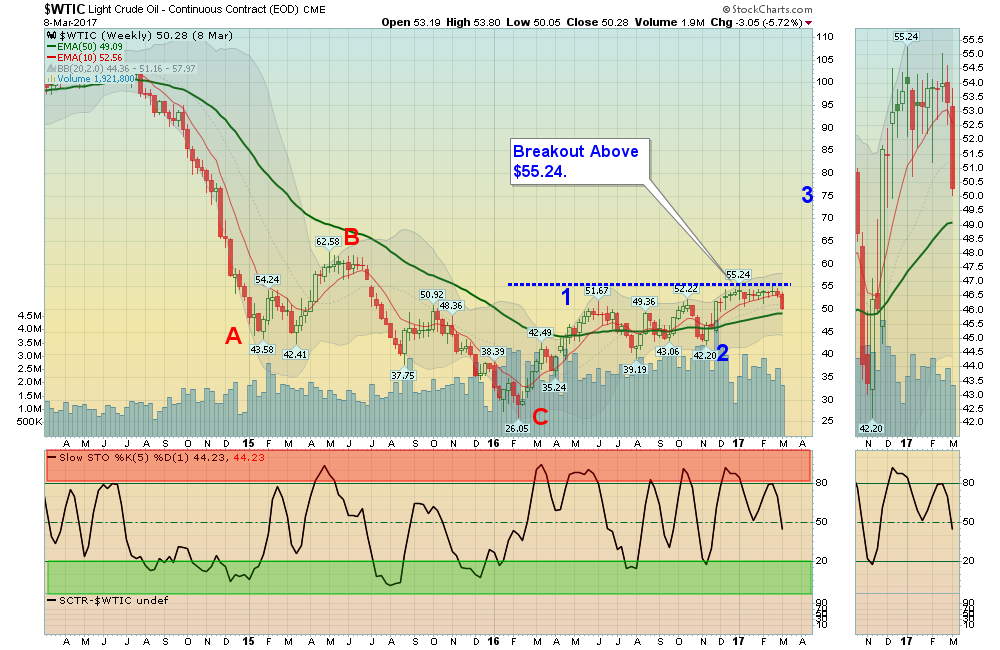
Crude Oil is down to the Green Line of $49! 

The Markets  are down again today, as Crude Oil has dropped another 2%.  Crude Oil is down to the Green Line. Most Metals and Oil Investments (see Watch List) have had nice pull-backs, and their Relative Strength values have remained Above 90 (indicating a good Rally Pop potential!).

Many are waiting on probable FED RAISE next Wednesday. Commodities have dumped with the Rising US Dollar, but the Dollar should take profits on the FED News.

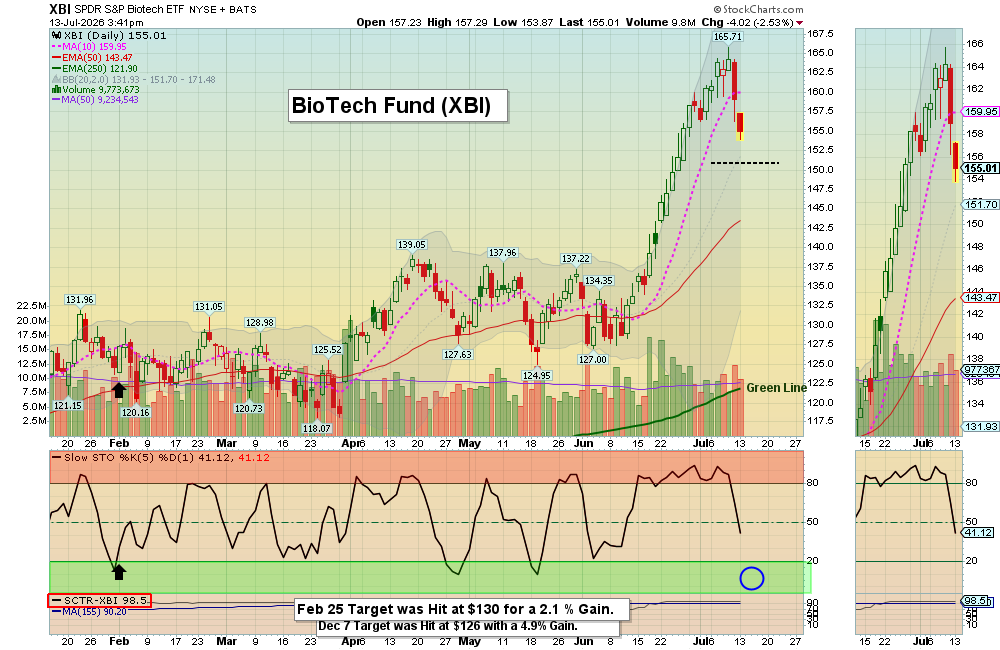
The Market Indices are still holding up very well, even with some Indices falling Below the Pink Lines (10-day avgs.)  and creating Short Term Sell Signals.  Looks like the DOW wants to try the Highs again, and the Long Watch List below agrees.

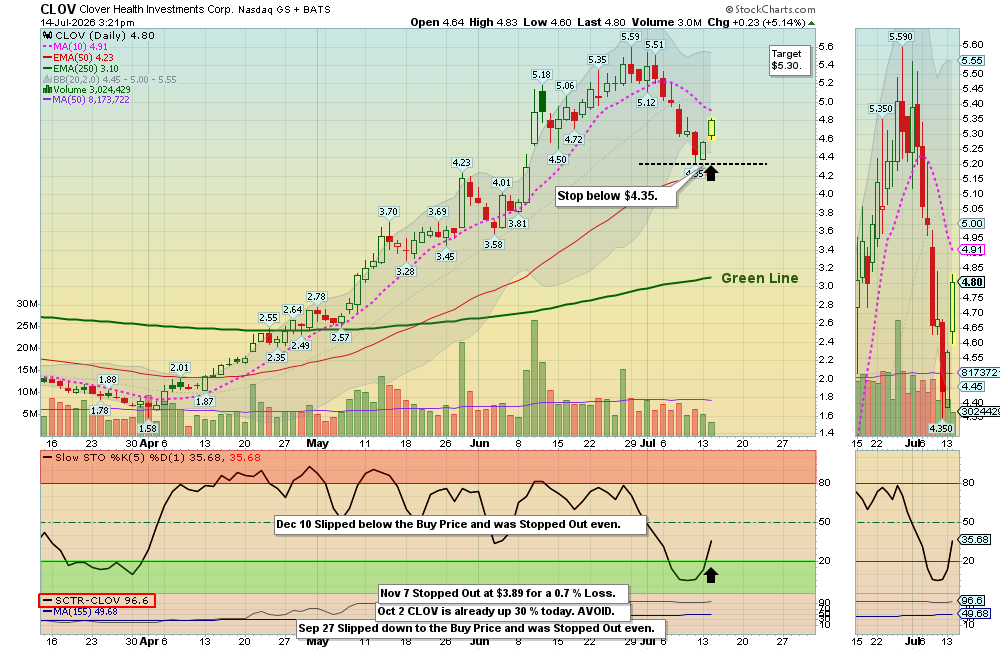
The Reward / Risk  ratio of investing now is poor, so please do not Buy unless you are VERY NIMBLE, as the Leaders are still Way Above the Green Lines.

Many Money Wave Buys soon!  
The Following Investments will probably have a Money Wave Buy Signal 
(Slow Stochastic Closing > 20) on today’s Close.

BUYS:     PIP  PHARM ATHENE   Money Wave Buy today. We will not Log, as it is already up 19% today!


ON DECK to Buy soon:   AKS   AK STEEL ,   ARNC   ARCONIC INC, CENX  CENTURY ALUMINUM,    CLF  CLIFFS NAT’L RES.  CSX   CSX CORP,   DIA   DOW 30 FUND,   FCAU   FIAT CHRYSLER,  JPM   JP MORGAN,  KRE   BANKING INDEX,   LUV   SOUTHWEST AIR,   SN   SANCHEZ ENERGY,   VALE   VALE DE RIO,  X   US STEEL,   XME   METALS & MINING FUND.   We will email when they are ready.


SELLS

WE will LOWER the STOP again on   EWZ  BRAZIL FUND  to today’s low of $36.19, as EWZ is already back down in the Green Zone, & the Relative Strength is still 96. (For Short Term Portfolio only). We will probably try to Bail if it gets back up around $38.

EXIT WDC   WESTERN DIGITAL if you are still in, as it is going to Close below the Pink Line of  $76.43.


Click for  WATCH LIST   

Click for  OPEN POSITIONS

Click for  CLOSED POSITIONS

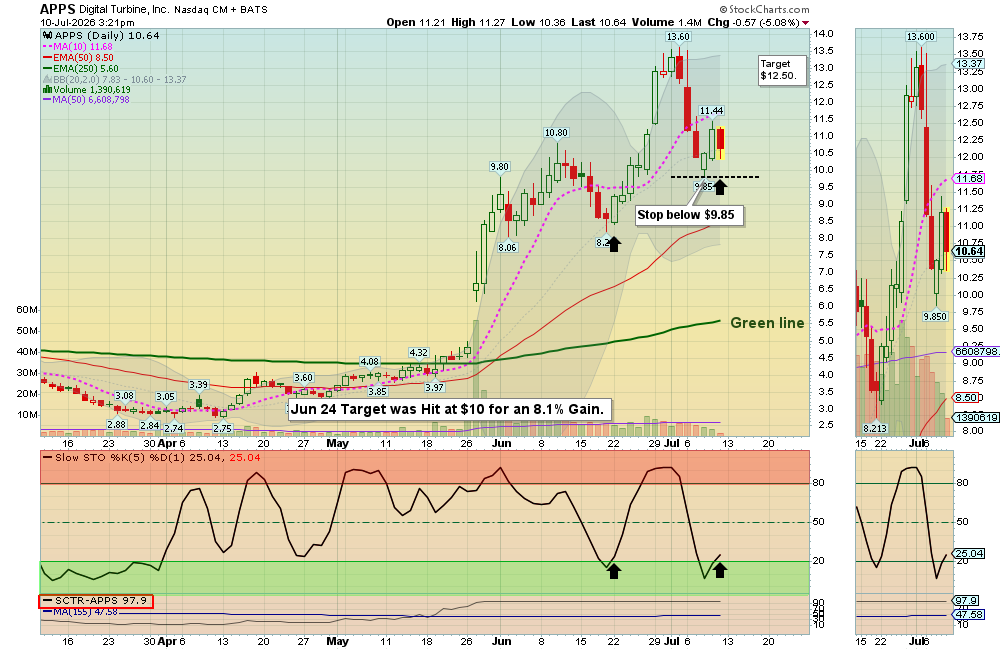
Many like to Buy the day before, near the Close, if the Money Wave is going to create a Buy Signal (Closing > 20).

Don’t Buy if the Investment has already popped up too much. Money Wave Buys are usually good for a 3-6 %  move in a few days.

About 1/3 of the time, the Money Wave Buys will result small losses, so please use a Sell Stop Loss after all Buy orders.

Related Post

– Money Wave Alert! Mar 8, 2017

Subscribe to Our Newsletter

AGL Logo

Get our eBook Now!

Candlestick - A Swing Traders Friend

We don’t spam! Read our privacy policy for more info.

You’ve been successfully subscribed to our newsletter!

Voted #1 at Stock Charts

SH Chart
Inverse S&P 500 Fund (SH) will have a Money Wave Buy today.

Help Us Help Animals

Help Us Help Animals

Recent Comments

  • Market Breadth Indicators: A Trader’s Guide to Early Trend Detection on Backtesting: Definition and How a Trading Strategy Backtest Works
  • Island Reversal Pattern: Definition and Formation Explained on Double Top Pattern: How to Identify and Trade This Reversal Signal
  • Channel Pattern Guide: What It Is and Why It Matters on A Guide to Forecasting Using Moving Averages
  • What Is a Broadening Bottom Chart Pattern? Full Guide on Bull vs. Bear Market: An Investor’s Guide to Market Phases
  • ATGL Weekly Money Flow - 2025-05-11 on ATGL Top Pick of the Week! Apr 6, 2025

Become a Green Liner!

Help me make more Money in the Stock Market.

ON ATGL

  • DashBoard
  • Weekly Commentary
  • Daily Buy / Sell Signals
  • Day Trade Setup
  • Trading Rooms

Design & Develop By Pixelvect

STRATEGIES

  • Swing Trading
  • ATGL Pick of the Week
  • Dividend Growth
  • ETF Sector Rotation
  • Dogs of the Dow

HELP

  • ATGL Trading Rules
  • FAQ
  • Account Maintenance
  • Contact US
  • Join

FOLLOW US

Instagram Linkedin Twitter Facebook

© COPYRIGHT 2024 · ABOVETHEGREENLINE.COM · ALL RIGHTS RESERVED · PRIVACY · TERMS · CONTACT · WATCHLIST · CURRENT