Above the Green Line -01
  • Market Insights
        • Commentary
          • Daily
          • Weekly
        • BUY / SELL SIGNALS
          • Trade Posts
          • Recent Trade Alerts
          • Recent Day Trades
        • BLOGROLL
          • Dividend Growth Blog
          • ETF Sector Blog
          • Dow Dogs
          • TPOW Blog
  • Strategies
        • SWING TRADING
          • Current Positions
          • Watchlists
          • Closed Positions
          • Candidates - TOP 100
          • Specialty Stocks
        • WEEKLY STOCK PICK
          • TPOW Charts
          • TPOW Performance
          • TPOW Strategy Guide
          • TPOW Performance Dashboard
        • DAY TRADING
          • Watch List
        • ATGL DASHBOARD
        • ETF STRATEGIES
          • ETF Sector Rotation
          • ETF Sector Portfolio
        • DIVIDEND GROWTH
          • Dividend Growth Portfolio
          • Dividend Calendar
        • DOGS OF THE DOW
          • Dogs of the Dow Portfolio
          • DOW 5 Portfolio
  • Markets
        • US MARKET
          • Commodities
          • Energy
          • Precious Metals
          • Volatility
        • GLOBAL MARKETS
          • Market Indices
          • Economic Calendar
          • FOREX Heat Map
          • FOREX Cross Rates
          • Crypto Currency Market
  • Investing
    • Discord Community
    • Dashboard
  • Resources
        • ARTICLES
          • Dividend Growth Model Articles
          • ETF Articles
          • Investment Strategies Articles
          • Market and Economic Insights
          • Stock Trade Articles
          • Stock Reviews
        • TOOLS
          • Stock Scanners
          • Charting Software
          • Brokerage Firms
        • STOCK CHARTS
          • Key Components
          • Reading Charts
          • Drawing Stock Charts
          • Identifying Trends
        • RETIREMENT PLANNING
  • About
    • Contact Us
    • How to Win
    • #1 At Stockcharts
    • Disclaimer
    • FAQ
  • Log In
  • Subscribe

March 8, 2021

Money Wave Alert! Mar 8, 2021

NIO Chart
Some Leaders like NIO Inc. (NIO) are quickly down to the Green Lines.

Markets were mostly higher today but some Big Tech and Momentum Stocks continued lower. Many newer Investors did not realize how High the Momentum Stocks had become, and are now panic selling the Leaders after they have dropped 30 – 60 % from the recent Highs. Some Investors bought with borrowed Money (on margin) and are being forced to Sell.

The Momentum Leaders  should pop at least 1/2 way back up when the Selling is over.  Try to only Buy the Leaders that are still holding above the Red Lines (50-day avgs.) 

The DOW 30  and Small Cap Indices are holding up fine, but Momentum Stocks are currently getting Flushed. We are lowering the Sell Stops on positions, as long as they are Above the Green Lines. Most Swing Trade positions recently made fresh New Highs and they should bounce up to re-test the recent Highs after emotional dumps. High Relative Strength should prevail…

We are being conservative and only Buying Signals now if the Volume is High (at least 1.25 X the 50-day avg. Volume). The better trades happen when the S&P 500 Index is also in the Green Zone  (now coming down from the Red Zone). 

More Money Wave Buys soon in DAY TRADING SETUPS

Bonds  were up slightly, but are below the Green Line.

Crude Oil was down $1.25 today at $64.84.

BUYS TODAY    3/8/2021   

FUTU      FUTU HOLDINGS      Money Wave Buy today. Target is $171.00. EXIT if it is going to Close below the Red Line of $118.96.

BNGO      BIONANO GENOMICS      Money Wave Buy today.  BNGO will not be logged as it is already up 14 % today.

VERU      VERU INC.      Money Wave Buy today.  VERU will not be logged as the Volume is below average.

We will “Not Log” trades if the Reward/Risk is not at least 2:1.  These have more risk.     

JUMP START: (Buy Signal should be very soon… Click on the Jump Start link for more info.)   

SNAP      SNAP INC.

____________________________________________________________________________________________________________

WATCH LIST

WATCH LIST SCROLLING CHARTS (Real Time)      

DDD      3D SYSTEMS      (2nd Buy Signal Soon)     

FSR      FISKER INC.

GEVO      GEVO INC.      Buy above the Pink Line on High Volume with a 5% Trailing Sell Stop Loss below it.

MGNI      MAGNITE INC.      Buy above $42.35 on High Volume with a 5% Trailing Sell Stop Loss below it.

MVIS      MICROVISION INC.      Money Wave must Close in the Green Zone.

SINO      SINO GLOBAL SHIPPING

Please be patient and wait for Money Wave Buy Signals.  We will email you when they are ready. Follow on the WATCH LIST.
Emotions are very high now, so please do not Buy unless you are VERY NIMBLE.

The Leaders are Way Above the Green Lines (all Investments eventually return to their Green Lines).

____________________________________________________________________________________________________________

SELLS TODAY  No Stops today, please.

BIDU      BAIDU  INC.      LOWER the Sell Stop Loss below $220.00 until it bottoms. This trade was not logged.   

DDD      3D SYSTEMS CORP.      LOWER the Sell Stop Loss below $22.00 until it bottoms. This trade was not logged.     

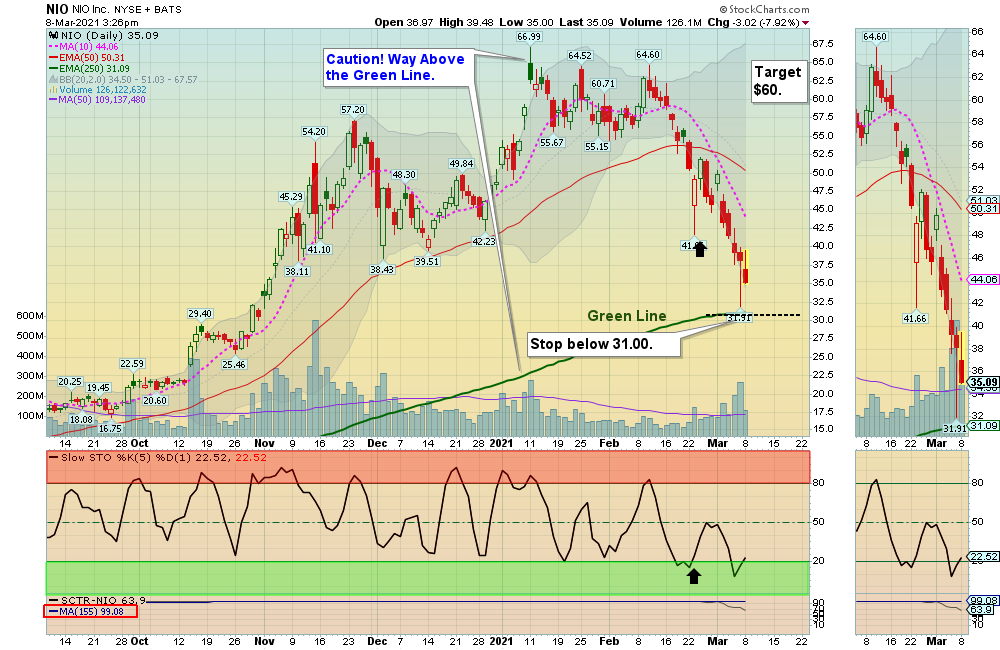
NIO      NIO INC.       LOWER the Sell Stop Loss below $31.00 until it bottoms.       

PACB      PACIFIC BIOSCIENCES      LOWER the Sell Stop Loss below $24.76 until it bottoms. This trade was not logged.   

Z        ZILLOW GROUP        LOWER the Sell Stop Loss below $122.00 until it bottoms. This trade was not logged. 

Please update your Sell Stops.    

Click for  CURRENT POSITION CHARTS – Real Time  (Please check and adjust your Sell Stops).         
Click for  CLOSED POSITIONS,   
NEW:       MY TRADING DASHBOARD

DAY TRADING SETUPS
NEW:  TRADE ALERTS
ARE YOUR INVESTMENTS ABOVE THE GREEN LINE?
ETF SECTOR ROTATION SYSTEM   
TOP 100 LIST Updated Mar 1, 2021

Many like to Buy the day before, near the Close, if the Money Wave is going to create a Buy Signal (Closing > 20 and out of the Green Zone).

Don’t Buy if the Investment has already popped up too much. Money Wave Buys are usually good for a 3-6 %  move in a few days.

We will “Not Log” trades if the Reward/Risk is not at least 2:1.  These have more risk.     

Related Post

– FUTU

Subscribe to Our Newsletter

AGL Logo

Get our eBook Now!

Candlestick - A Swing Traders Friend

We don’t spam! Read our privacy policy for more info.

You’ve been successfully subscribed to our newsletter!

Voted #1 at Stock Charts

SH Chart
Inverse S&P 500 Fund (SH) will have a Money Wave Buy today.

Help Us Help Animals

Help Us Help Animals

Recent Comments

  • Market Breadth Indicators: A Trader’s Guide to Early Trend Detection on Backtesting: Definition and How a Trading Strategy Backtest Works
  • Island Reversal Pattern: Definition and Formation Explained on Double Top Pattern: How to Identify and Trade This Reversal Signal
  • Channel Pattern Guide: What It Is and Why It Matters on A Guide to Forecasting Using Moving Averages
  • What Is a Broadening Bottom Chart Pattern? Full Guide on Bull vs. Bear Market: An Investor’s Guide to Market Phases
  • ATGL Weekly Money Flow - 2025-05-11 on ATGL Top Pick of the Week! Apr 6, 2025

Become a Green Liner!

Help me make more Money in the Stock Market.

ON ATGL

  • DashBoard
  • Weekly Commentary
  • Daily Buy / Sell Signals
  • Day Trade Setup
  • Trading Rooms

Design & Develop By Pixelvect

STRATEGIES

  • Swing Trading
  • ATGL Pick of the Week
  • Dividend Growth
  • ETF Sector Rotation
  • Dogs of the Dow

HELP

  • ATGL Trading Rules
  • FAQ
  • Account Maintenance
  • Contact US
  • Join

FOLLOW US

Instagram Linkedin Twitter Facebook

© COPYRIGHT 2024 · ABOVETHEGREENLINE.COM · ALL RIGHTS RESERVED · PRIVACY · TERMS · CONTACT · WATCHLIST · CURRENT