Above the Green Line -01
  • Market Insights
        • Commentary
          • Daily
          • Weekly
        • BUY / SELL SIGNALS
          • Trade Posts
          • Recent Trade Alerts
          • Recent Day Trades
        • BLOGROLL
          • Dividend Growth Blog
          • ETF Sector Blog
          • Dow Dogs
          • TPOW Blog
  • Strategies
        • SWING TRADING
          • Current Positions
          • Watchlists
          • Closed Positions
          • Candidates - TOP 100
          • Specialty Stocks
        • WEEKLY STOCK PICK
          • TPOW Charts
          • TPOW Performance
          • TPOW Strategy Guide
          • TPOW Performance Dashboard
        • DAY TRADING
          • Watch List
        • ATGL DASHBOARD
        • ETF STRATEGIES
          • ETF Sector Rotation
          • ETF Sector Portfolio
        • DIVIDEND GROWTH
          • Dividend Growth Portfolio
          • Dividend Calendar
        • DOGS OF THE DOW
          • Dogs of the Dow Portfolio
          • DOW 5 Portfolio
  • Markets
        • US MARKET
          • Commodities
          • Energy
          • Precious Metals
          • Volatility
        • GLOBAL MARKETS
          • Market Indices
          • Economic Calendar
          • FOREX Heat Map
          • FOREX Cross Rates
          • Crypto Currency Market
  • Investing
    • Discord Community
    • Dashboard
  • Resources
        • ARTICLES
          • Dividend Growth Model Articles
          • ETF Articles
          • Investment Strategies Articles
          • Market and Economic Insights
          • Stock Trade Articles
          • Stock Reviews
        • TOOLS
          • Stock Scanners
          • Charting Software
          • Brokerage Firms
        • STOCK CHARTS
          • Key Components
          • Reading Charts
          • Drawing Stock Charts
          • Identifying Trends
        • RETIREMENT PLANNING
  • About
    • Contact Us
    • How to Win
    • #1 At Stockcharts
    • Disclaimer
    • FAQ
  • Log In
  • Subscribe

March 27, 2025

Money Wave Alert! Mar 27, 2025

BABA chart
Swing Trade Buy on the Close for Alibaba Group $BABA.
SWING TRADING (SHORT TERM)
Watchlist and Charts
Watch ListWatch List Charts
Current PositionsCurrent Charts
Closed ResultsTrading Dashboard
TOP PICK OF THE WEEK
Current Pick and Chart
Top Pick of the WeekFeatured Stock Chart

March 27, 2025, Today the Nasdaq market was not very strong, and continued yesterday’s downside momentum. It looks like we might see another move up as this could be a healthy correction. SPY also attempted to hold steady and had a daily pop-off, signaling potential positive movement ahead. The VIX went up, indicating some uncertainty in the market. However, key support levels are still intact, suggesting no major breakdown yet. We remain cautious but watch for confirmation of an upward move.

Wait for more Buy Signals coming up out of the Green Zones. CHARTS  The best moves happen when the S&P 500 Index is also coming up out of the Green Zone. ______________________________________________________________________________

BUYS TODAY   3/27/2025      

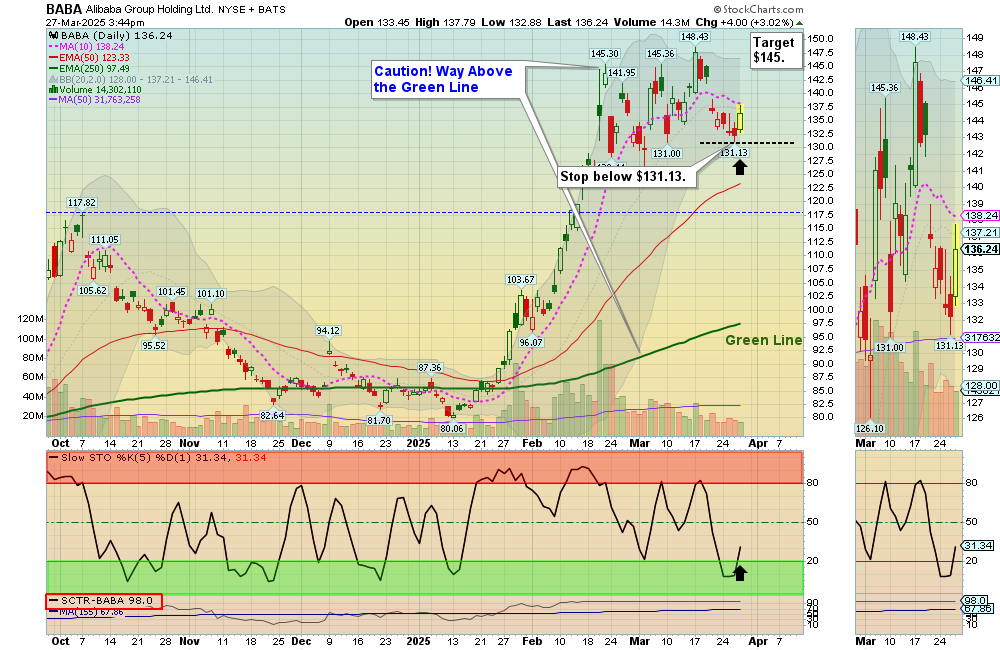
BABA      Alibaba Group Holding Ltd.        Swing Trade Buy on the Close today, but the Volume is not high (2 Star trade).   
FXI      iShares China Large-Cap Fund      Swing Trade Buy on the Close today, but the Volume is not high (2 Star trade). 
KC      KINGSOFT CLOUD          Swing Trade Buy on the Close today, but the Volume is not high (2 Star trade). 

BUYS SOON           

 TUYA      TUYA INC.    Wat for next Daily Money Wave Close > 20 with High Volume.           
XPEV      XPENG INC.      Wait for next Daily Money Wave Close > 20 with High Volume. 
ERJ      Embraer SA.      Wait for next Daily Money Wave Close > 20 with High Volume. 

Shop for a better price earlier in the day with Green Candle Buy Signal, on the same day that a Daily Money Wave Buy Signal will occur.        

Many like to Buy the Swing Trades just before the Close, if the Money Wave is going to create a Buy Signal (Closing > 20 and up out of the Green Zone). Don’t Buy if the Security has already popped up too much. Money Wave Buy Signals are usually good for a 3-6 % move in a few days.       

SELLS TODAY          

APP            APPLOVIN CORP.   EXIT if it is going to Close below the Pink Line around $308.60.     
_____________________________________________________________________________

DAY TRADING SETUPS.  Today we had 15 tiny scalp trades for nice Gains at our Trading Room. In this Emotional Market now, Day Trading Alerts are not being sent out on our Discord Site with Live Chatting. Please install Discord app on your PC or cell for mobile notifications. Check out our Live Stream.

Or look for Green Candle Buy Pops (Red Candle turns Green). Big Movers today:    BABX + 7%  NUGT+6% TSLA  +6%                   

BANANA HUNT TRADING CHARTS.

Bonds were down today and are Above the Green Line. 
Crude Oil was up $0.21 today at $69.87.    

NEW! TOP PICK OF THE WEEK

MY TRADING DASHBOARD 
SWING TRADING CURRENT POSITIONS
DAY TRADING SETUPS
TRADE ALERTS
STAGE CHART INVESTING
GREEN LINE CHARTS AT STOCKCHARTS
ARE YOUR INVESTMENTS ABOVE THE GREEN LINE?
GREEN LINE RULES
ETF SECTOR ROTATION SYSTEM
Updated TOP 100 LIST Updated Mar 1, 2024       

Important Links

Top 100Stage Chart InvestingCNN Fear & Greed Index
Dividend Growth PortfolioETF Sector PortfolioDogs of the Dow
Long Term StrategyStage Chart InvestingArticles
      

* Safer Trades that meet ALL three criteria will be classified as 3 STAR, while trades that only meet two of the three criteria will be flagged as 2 STAR (more risk).


Subscribe to Our Newsletter

AGL Logo

Get our eBook Now!

Candlestick - A Swing Traders Friend

We don’t spam! Read our privacy policy for more info.

You’ve been successfully subscribed to our newsletter!

Voted #1 at Stock Charts

SH Chart
Inverse S&P 500 Fund (SH) will have a Money Wave Buy today.

Help Us Help Animals

Help Us Help Animals

Recent Comments

  • ATGL Weekly Money Flow - 2025-07-13 on AGTL Top Pick of the Week! May 11, 2025
  • Market Breadth Indicators: A Trader’s Guide to Early Trend Detection on Backtesting: Definition and How a Trading Strategy Backtest Works
  • Island Reversal Pattern: Definition and Formation Explained on Double Top Pattern: How to Identify and Trade This Reversal Signal
  • Channel Pattern Guide: What It Is and Why It Matters on A Guide to Forecasting Using Moving Averages
  • What Is a Broadening Bottom Chart Pattern? Full Guide on Bull vs. Bear Market: An Investor’s Guide to Market Phases

Become a Green Liner!

Help me make more Money in the Stock Market.

ON ATGL

  • DashBoard
  • Weekly Commentary
  • Daily Buy / Sell Signals
  • Day Trade Setup
  • Trading Rooms

Design & Develop By Pixelvect

STRATEGIES

  • Swing Trading
  • ATGL Pick of the Week
  • Dividend Growth
  • ETF Sector Rotation
  • Dogs of the Dow

HELP

  • ATGL Trading Rules
  • FAQ
  • Account Maintenance
  • Contact US
  • Join

FOLLOW US

Instagram Linkedin Twitter Facebook

© COPYRIGHT 2024 · ABOVETHEGREENLINE.COM · ALL RIGHTS RESERVED · PRIVACY · TERMS · CONTACT · WATCHLIST · CURRENT