Above the Green Line -01
  • Market Insights
        • Commentary
          • Daily
          • Weekly
        • BUY / SELL SIGNALS
          • Trade Posts
          • Recent Trade Alerts
          • Recent Day Trades
        • BLOGROLL
          • Dividend Growth Blog
          • ETF Sector Blog
          • Dow Dogs
          • TPOW Blog
  • Strategies
        • SWING TRADING
          • Current Positions
          • Watchlists
          • Closed Positions
          • Candidates - TOP 100
          • Specialty Stocks
        • WEEKLY STOCK PICK
          • TPOW Charts
          • TPOW Performance
          • TPOW Strategy Guide
          • TPOW Performance Dashboard
        • DAY TRADING
          • Watch List
        • ATGL DASHBOARD
        • ETF STRATEGIES
          • ETF Sector Rotation
          • ETF Sector Portfolio
        • DIVIDEND GROWTH
          • Dividend Growth Portfolio
          • Dividend Calendar
        • DOGS OF THE DOW
          • Dogs of the Dow Portfolio
          • DOW 5 Portfolio
  • Markets
        • US MARKET
          • Commodities
          • Energy
          • Precious Metals
          • Volatility
        • GLOBAL MARKETS
          • Market Indices
          • Economic Calendar
          • FOREX Heat Map
          • FOREX Cross Rates
          • Crypto Currency Market
  • Investing
    • Discord Community
    • Dashboard
  • Resources
        • ARTICLES
          • Dividend Growth Model Articles
          • ETF Articles
          • Investment Strategies Articles
          • Market and Economic Insights
          • Stock Trade Articles
          • Stock Reviews
        • TOOLS
          • Stock Scanners
          • Charting Software
          • Brokerage Firms
        • STOCK CHARTS
          • Key Components
          • Reading Charts
          • Drawing Stock Charts
          • Identifying Trends
        • RETIREMENT PLANNING
  • About
    • Contact Us
    • How to Win
    • #1 At Stockcharts
    • Disclaimer
    • FAQ
  • Log In
  • Subscribe

March 18, 2022

Money Wave Alert! Mar 18, 2022

QQQ Chart
The NASDAQ 100 Fund (QQQ) needs to get back Above the Green Line.

Markets were higher again today on follow thru buying from Monday’s low. Many of the Short Sellers that bet the Markets had turned Bear are getting blasted, and are having to cover or Buy back their Short positions. The DOW 30 & S&P 500 Indices are both back Above the Green Lines, and the Stronger Investments are trying to also Close above the Red Lines (50-day averages).

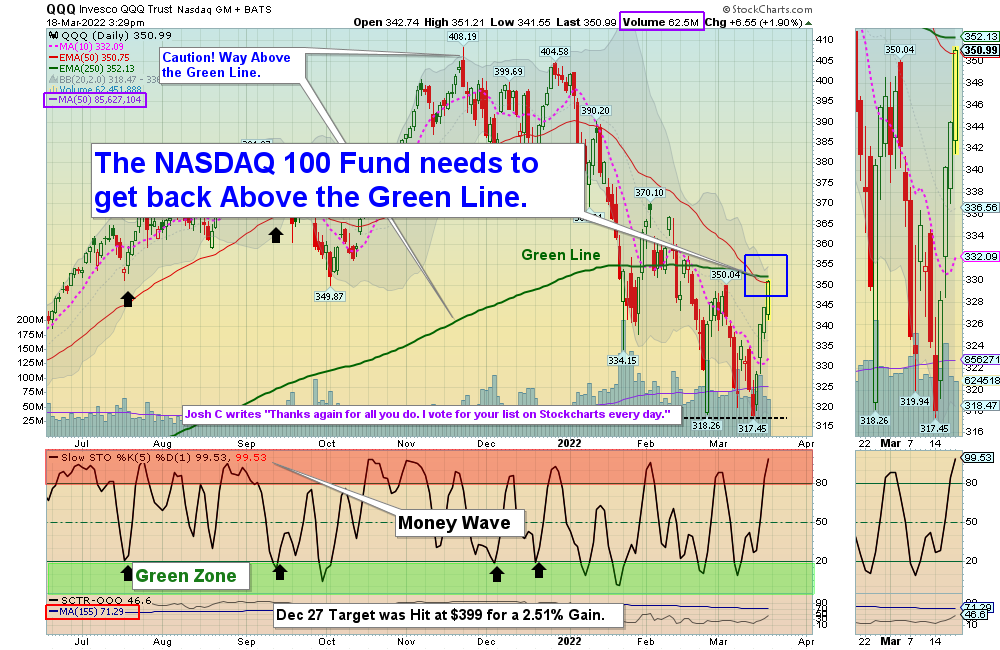
But the weaker NASDAQ 100 & Small Cap Indices are still below the Green Lines, and the Volume is not strong, so all is not well. The strong Commodities have corrected back down to the Green Zones for some Buy Signals. We currently only have 4 of 10 positions, and hope to Buy more soon after this emotional Flushing is over.

New Subscribers:  We need High Volume for better moves up. Please be patient and Wait for more Buy Signals soon. BUYS SOON – CHARTS  The best moves are when the S&P 500 Index is also coming up out of the Green Zone. (Now back in the Red Zone).

BUYS TODAY    3/18/2022       

NVDA      NVIDIA CORP.      Looks like it will Close Above the Red Line this week for a Longer Term Buy, but it is already up 18 %. We will Wait for a pull-back next week, as the Daily Chart is up in the Red Zone.

XLRE      REAL ESTATE FUND      Looks like it will Close Above $46.88 this week for a Longer Term Buy, but the Volume was not High. We will Wait for a pull-back next week, as the Daily Chart is up in the Red Zone.

BUYS TOMORROW – JUMP START STOCKS  Shop for a better price earlier in the day. Only use Jump Start on the same day that a Daily Money Wave Buy Signal will occur.   

SLB      SCHLUMBERGER LTD.      Buy above $40.55 with High Volume with a 5% Trailing Sell Stop Loss below it.   

XOM      EXXON MOBILE CORP.    Buy above $79.39 with High Volume with a 5% Trailing Sell Stop Loss below it.

BUYS SOON – CHARTS      WATCH LIST

F      FORD MOTOR CO.     Buy above $16.83 with High Volume with a 5% Trailing Sell Stop Loss below it.     

PBR      PETROBRAS ENERGY      Money Wave must Close in the Green Zone.     

SARK      INVERSE ARK INNOVATION FUND      Wait for Money Wave Close > 20 with High Volume. 

Please be patient and wait for Money Wave Buy Signals.  We will email you when they are ready. Follow on the WATCH LIST.      
The Leaders are Way Above the Green Lines (all Investments eventually return to their Green Lines).   

SELLS TODAY     NONE TODAY

_________________________________________________________________________________________________________________

DAY TRADING SETUPS.  A few Triple Buy Pops today. BBIG (+6%) IMPP (+10%) PHUN (+5%) & RBLX (+6%). Try out the New Side by Side layout.   

DAY TRADING FOR INDICES & LARGE CAPS CHARTS.

Bonds  were up today, but are Below the Green Line. 

Crude Oil was up $1.78 today at $104.76.

_________________________________________________________________________________________________________________

MY TRADING DASHBOARD 
SWING TRADING CURRENT POSITIONS
DAY TRADING SETUPS
TRADE ALERTS
ARE YOUR INVESTMENTS ABOVE THE GREEN LINE?
GREEN LINE RULES
ETF SECTOR ROTATION SYSTEM   
New TOP 100 LIST Updated Mar 1, 2022

Many like to Buy the Swing Trades just before the Close, if the Money Wave is going to create a Buy Signal (Closing > 20 and up out of the Green Zone).

Don’t Buy if the Investment has already popped up too much. Money Wave Buy Signals are usually good for a 3-6 %  move in a few days.

We will “Not Log” trades if the Reward/Risk is not at least 2:1, or Low Volume. These have more risk.


HAVE A NICE WEEKEND!

Related Post

– SLB

Subscribe to Our Newsletter

AGL Logo

Get our eBook Now!

Candlestick - A Swing Traders Friend

We don’t spam! Read our privacy policy for more info.

You’ve been successfully subscribed to our newsletter!

Voted #1 at Stock Charts

SH Chart
Inverse S&P 500 Fund (SH) will have a Money Wave Buy today.

Help Us Help Animals

Help Us Help Animals

Recent Comments

  • Market Breadth Indicators: A Trader’s Guide to Early Trend Detection on Backtesting: Definition and How a Trading Strategy Backtest Works
  • Island Reversal Pattern: Definition and Formation Explained on Double Top Pattern: How to Identify and Trade This Reversal Signal
  • Channel Pattern Guide: What It Is and Why It Matters on A Guide to Forecasting Using Moving Averages
  • What Is a Broadening Bottom Chart Pattern? Full Guide on Bull vs. Bear Market: An Investor’s Guide to Market Phases
  • ATGL Weekly Money Flow - 2025-05-11 on ATGL Top Pick of the Week! Apr 6, 2025

Become a Green Liner!

Help me make more Money in the Stock Market.

ON ATGL

  • DashBoard
  • Weekly Commentary
  • Daily Buy / Sell Signals
  • Day Trade Setup
  • Trading Rooms

Design & Develop By Pixelvect

STRATEGIES

  • Swing Trading
  • ATGL Pick of the Week
  • Dividend Growth
  • ETF Sector Rotation
  • Dogs of the Dow

HELP

  • ATGL Trading Rules
  • FAQ
  • Account Maintenance
  • Contact US
  • Join

FOLLOW US

Instagram Linkedin Twitter Facebook

© COPYRIGHT 2024 · ABOVETHEGREENLINE.COM · ALL RIGHTS RESERVED · PRIVACY · TERMS · CONTACT · WATCHLIST · CURRENT