Above the Green Line -01
  • Market Insights
        • Commentary
          • Daily
          • Weekly
        • BUY / SELL SIGNALS
          • Trade Posts
          • Recent Trade Alerts
          • Recent Day Trades
        • BLOGROLL
          • Dividend Growth Blog
          • ETF Sector Blog
          • Dow Dogs
          • TPOW Blog
  • Strategies
        • SWING TRADING
          • Current Positions
          • Watchlists
          • Closed Positions
          • Candidates - TOP 100
          • Specialty Stocks
        • WEEKLY STOCK PICK
          • TPOW Charts
          • TPOW Performance
          • TPOW Strategy Guide
          • TPOW Performance Dashboard
        • DAY TRADING
          • Watch List
        • ATGL DASHBOARD
        • ETF STRATEGIES
          • ETF Sector Rotation
          • ETF Sector Portfolio
        • DIVIDEND GROWTH
          • Dividend Growth Portfolio
          • Dividend Calendar
        • DOGS OF THE DOW
          • Dogs of the Dow Portfolio
          • DOW 5 Portfolio
  • Markets
        • US MARKET
          • Commodities
          • Energy
          • Precious Metals
          • Volatility
        • GLOBAL MARKETS
          • Market Indices
          • Economic Calendar
          • FOREX Heat Map
          • FOREX Cross Rates
          • Crypto Currency Market
  • Investing
    • Discord Community
    • Dashboard
  • Resources
        • ARTICLES
          • Dividend Growth Model Articles
          • ETF Articles
          • Investment Strategies Articles
          • Market and Economic Insights
          • Stock Trade Articles
          • Stock Reviews
        • TOOLS
          • Stock Scanners
          • Charting Software
          • Brokerage Firms
        • STOCK CHARTS
          • Key Components
          • Reading Charts
          • Drawing Stock Charts
          • Identifying Trends
        • RETIREMENT PLANNING
  • About
    • Contact Us
    • How to Win
    • #1 At Stockcharts
    • Disclaimer
    • FAQ
  • Log In
  • Subscribe

June 15, 2022

Money Wave Alert! Jun 15, 2022

Wow! This could be the best buying opportunity of the year!

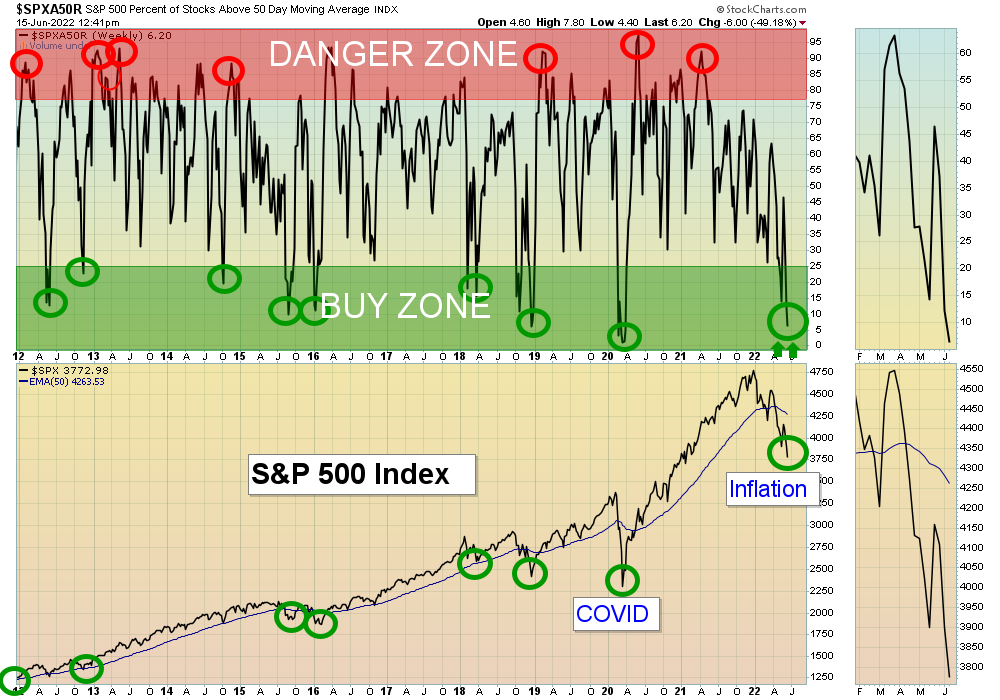
Markets rallied today on the Bad News of the Federal Reserve raising Short Term Interest Rates by 3/4 %. And good news for Smart Money is that only 6% of stocks in the S&P 500 Index are currently above the 50 Day Average, the lowest number since the pandemic (see Chart above). This tells us that most of the stocks have tanked, and history shows that Smart Money uses that as an opportunity to buy. 

The Strongest Leaders below are back down to the Green Zones (probably too late to Sell for the Short Term) for more Money Wave Buy Signals soon. Hopefully you have some Cash to Buy the Leaders. 

The Markets and most Investments are weak (Below the Green Lines), so please be patient wait for more Money Wave Buy Signals. BUYS SOON – CHARTS  The best moves are when the S&P 500 Index is also coming up out of the Green Zone (Now in the Green Zone). 

BUYS TODAY  6/15/2022 

MOS      MOSAIC CO.    Money Wave Buy today, but MOS will not be Bought or Logged as the Volume is below average of 8.6 MIL.

We will “Not Log” trades if the Reward/Risk is not at least 2:1, or Low Volume. These have more risk.

BUYS TOMORROW – SWING TRADING STOCKS 

Shop for a better price earlier in the day with Triple Buy Signal, on the same day that a Daily Money Wave Buy Signal will occur.  

OXY      OCCIDENTAL PETROLEUM CORP      Wait for Money Wave Close > 20 with High Volume.

PBR      PETROLEO BRASILEIRO (PETROBRAS)      Wait for Money Wave Close > 20 with High Volume.

SBLK      STAR BULK CARRIERS    Buy above $27.17 with High Volume with a 5% Trailing Sell Stop Loss below it.

SIGA      SIGA TECHNOLOGIES      Buy above $10.66 with High Volume with a 5% Trailing Sell Stop Loss below it.

BUYS SOON – CHARTS      WATCH LIST    

BTU      PEABODY ENERGY      Wait for Money Wave Close > 20 with High Volume.

GOGL      GOLDEN OCEAN GROUP      Wait for Money Wave Close > 20 with High Volume.

MRK      MERCK AND CO       Wait for Money Wave Close > 20 with High Volume.

SWN      SOUTHWESTERN ENERGY CO      Wait for Money Wave Close > 20 with High Volume.

XLE      ENERGY SELECT SECTOR      Wait for Money Wave Close > 20 with High Volume.

Please be patient and wait for Money Wave Buy Signals.  We will email you when they are ready. Follow on the WATCH LIST.      
The Leaders are Way Above the Green Lines (all Investments eventually return to their Green Lines).   

SELLS TODAY     NONE TODAY               
___________________________________________________________________________________________________________________

DAY TRADING SETUPS.  A few Triple Buy Pops today: AMC (6.12%) RBLX (8.04%) & SOXL (+8%). Try out the New Side by Side layout.   

DAY TRADING FOR INDICES & LARGE CAPS CHARTS.

Bonds were up today, but are still Way Below the Green Line.  

Crude Oil was down $2.87 at $116.06.

MY TRADING DASHBOARD 
SWING TRADING CURRENT POSITIONS
DAY TRADING SETUPS
TRADE ALERTS
GREEN LINE CHARTS AT STOCKCHARTS
ARE YOUR INVESTMENTS ABOVE THE GREEN LINE?
GREEN LINE RULES
ETF SECTOR ROTATION SYSTEM   
New TOP 100 LIST Updated Jun 3, 2022

Many like to Buy the Swing Trades just before the Close, if the Money Wave is going to create a Buy Signal (Closing > 20 and up out of the Green Zone).

Don’t Buy if the Investment has already popped up too much. Money Wave Buy Signals are usually good for a 3-6 %  move in a few days.

We will “Not Log” trades if the Reward/Risk is not at least 2:1, or Low Volume. These have more risk.

Related Post

– MOS

Subscribe to Our Newsletter

AGL Logo

Get our eBook Now!

Candlestick - A Swing Traders Friend

We don’t spam! Read our privacy policy for more info.

You’ve been successfully subscribed to our newsletter!

Voted #1 at Stock Charts

SH Chart
Inverse S&P 500 Fund (SH) will have a Money Wave Buy today.

Help Us Help Animals

Help Us Help Animals

Recent Comments

  • Market Breadth Indicators: A Trader’s Guide to Early Trend Detection on Backtesting: Definition and How a Trading Strategy Backtest Works
  • Island Reversal Pattern: Definition and Formation Explained on Double Top Pattern: How to Identify and Trade This Reversal Signal
  • Channel Pattern Guide: What It Is and Why It Matters on A Guide to Forecasting Using Moving Averages
  • What Is a Broadening Bottom Chart Pattern? Full Guide on Bull vs. Bear Market: An Investor’s Guide to Market Phases
  • ATGL Weekly Money Flow - 2025-05-11 on ATGL Top Pick of the Week! Apr 6, 2025

Become a Green Liner!

Help me make more Money in the Stock Market.

ON ATGL

  • DashBoard
  • Weekly Commentary
  • Daily Buy / Sell Signals
  • Day Trade Setup
  • Trading Rooms

Design & Develop By Pixelvect

STRATEGIES

  • Swing Trading
  • ATGL Pick of the Week
  • Dividend Growth
  • ETF Sector Rotation
  • Dogs of the Dow

HELP

  • ATGL Trading Rules
  • FAQ
  • Account Maintenance
  • Contact US
  • Join

FOLLOW US

Instagram Linkedin Twitter Facebook

© COPYRIGHT 2024 · ABOVETHEGREENLINE.COM · ALL RIGHTS RESERVED · PRIVACY · TERMS · CONTACT · WATCHLIST · CURRENT