Above the Green Line -01
  • Market Insights
        • Commentary
          • Daily
          • Weekly
        • BUY / SELL SIGNALS
          • Trade Posts
          • Recent Trade Alerts
          • Recent Day Trades
        • BLOGROLL
          • Dividend Growth Blog
          • ETF Sector Blog
          • Dow Dogs
          • TPOW Blog
  • Strategies
        • SWING TRADING
          • Current Positions
          • Watchlists
          • Closed Positions
          • Candidates - TOP 100
          • Specialty Stocks
        • WEEKLY STOCK PICK
          • TPOW Charts
          • TPOW Performance
          • TPOW Strategy Guide
          • TPOW Performance Dashboard
        • DAY TRADING
          • Watch List
        • ATGL DASHBOARD
        • ETF STRATEGIES
          • ETF Sector Rotation
          • ETF Sector Portfolio
        • DIVIDEND GROWTH
          • Dividend Growth Portfolio
          • Dividend Calendar
        • DOGS OF THE DOW
          • Dogs of the Dow Portfolio
          • DOW 5 Portfolio
  • Markets
        • US MARKET
          • Commodities
          • Energy
          • Precious Metals
          • Volatility
        • GLOBAL MARKETS
          • Market Indices
          • Economic Calendar
          • FOREX Heat Map
          • FOREX Cross Rates
          • Crypto Currency Market
  • Investing
    • Discord Community
    • Dashboard
  • Resources
        • ARTICLES
          • Dividend Growth Model Articles
          • ETF Articles
          • Investment Strategies Articles
          • Market and Economic Insights
          • Stock Trade Articles
          • Stock Reviews
        • TOOLS
          • Stock Scanners
          • Charting Software
          • Brokerage Firms
        • STOCK CHARTS
          • Key Components
          • Reading Charts
          • Drawing Stock Charts
          • Identifying Trends
        • RETIREMENT PLANNING
  • About
    • Contact Us
    • How to Win
    • #1 At Stockcharts
    • Disclaimer
    • FAQ
  • Log In
  • Subscribe

July 1, 2022

Money Wave Alert! Jul 1, 2022

TYX Chart
Long Term Interest Rates had a False Break Out, which could mean lower rates are coming.

MARKETS WILL BE CLOSED ON MONDAY FOR JULY 4TH HOLIDAY.

Markets were higher today on lower pre-holiday Buying. Some of the Indices are trying to get back above the the Pink Lines (10-day avgs.). The Markets need to put in a Higher Low soon to show any sign of bottoming. Semiconductors made new lows again today.

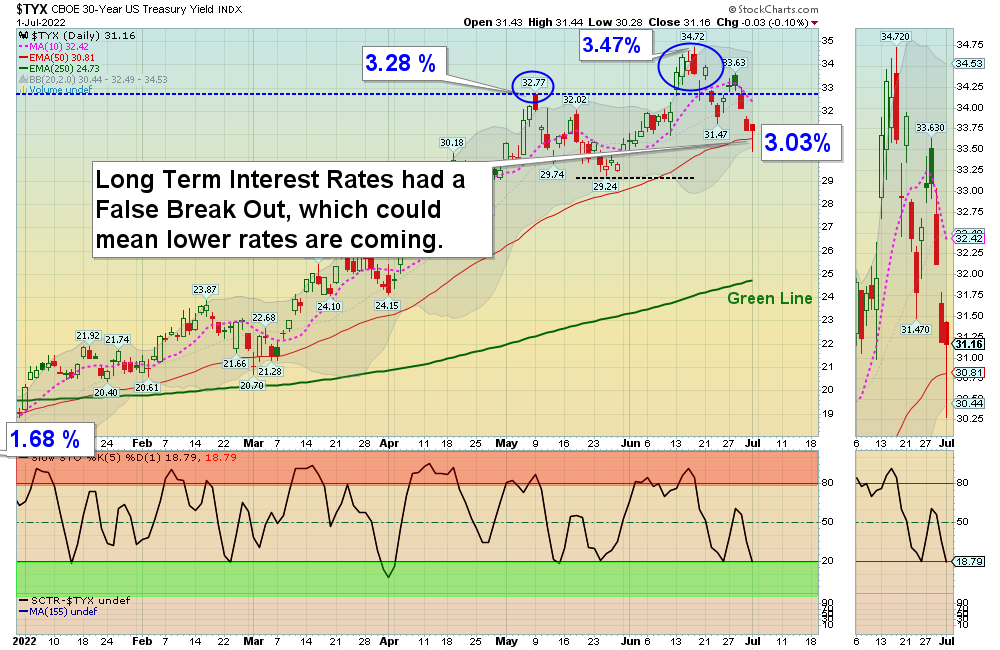
The major Indices are all Below the Green Lines as long as Inflation and Interest Rates remain high. But both have been dropping recently as the Economy slows down.

The Markets and most Investments are Below the Green Lines, so please be patient and wait for Signals for Investments that are still Above the Green Lines.  BUYS SOON – CHARTS  The best moves are when the S&P 500 Index is also coming up out of the Green Zone (Soon). 

The ETF SECTOR ROTATION SYSTEM  sold all 5 positions yesterday, and then will allocate 20% evenly into each of the same 5 Positions to be bought on the Close today. The System will Buy back the same 5 Funds (SPY QQQ XLE XLF & XLU).

BUYS TODAY   7/1/2022     NONE TODAY 


BUYS TOMORROW – SWING TRADING STOCKS 

Shop for a better price earlier in the day with Triple Buy Signal, on the same day that a Daily Money Wave Buy Signal will occur.  

DBC      COMMODITY FUND      Wait for Money Wave Close > 20 with High Volume.

GOGL      GOLDEN OCEAN GROUP      Changed to Long Term Investment.     

MPC      MARATHON PETE.      Wait for Money Wave Close > 20 with High Volume.

BUYS SOON – CHARTS      WATCH LIST     

VERU      VERU INC.      Wait for Money Wave Close > 20 with High Volume.

WEAT      WHEAT FUND      Money Wave must Close back above the Green Line.

XOP      OIL& GAS FUND      Money Wave must Close in the Green Zone,

Please be patient and wait for Money Wave Buy Signals.  We will email you when they are ready. Follow on the WATCH LIST.      

The Leaders are Way Above the Green Lines (all Investments eventually return to their Green Lines).   

SELLS TODAY                    

AMD      ADVANCED MICRO      LOWER the Sell Stop Loss below  $72.00 until it bottoms.  

RWM      INVERSE SMALL CAP FUND      Slipped below the Buy Price and was Stopped Out even. (Don’t Take a Loss!)

___________________________________________________________________________________________________________________

DAY TRADING SETUPS.  Several Triple Buy Pops today:  REV (+17%) RBLX (+8) MARA (+6%) & SIGA (+10%).  Try out the New Side by Side layout.    

DAY TRADING FOR INDICES & LARGE CAPS CHARTS.

Bonds were up again today, but are Way Below the Green Line.  

Crude Oil was up $2.54 at $108.30.

MY TRADING DASHBOARD 
SWING TRADING CURRENT POSITIONS
DAY TRADING SETUPS
TRADE ALERTS
GREEN LINE CHARTS AT STOCKCHARTS
ARE YOUR INVESTMENTS ABOVE THE GREEN LINE?
GREEN LINE RULES
ETF SECTOR ROTATION SYSTEM   
New TOP 100 LIST Updated Jun 3, 2022

Many like to Buy the Swing Trades just before the Close, if the Money Wave is going to create a Buy Signal (Closing > 20 and up out of the Green Zone).

Don’t Buy if the Investment has already popped up too much. Money Wave Buy Signals are usually good for a 3-6 %  move in a few days.

We will “Not Log” trades if the Reward/Risk is not at least 2:1, or Low Volume. These have more risk. 


HAVE A NICE LONG WEEKEND!

Related Post

– GOGL

Subscribe to Our Newsletter

AGL Logo

Get our eBook Now!

Candlestick - A Swing Traders Friend

We don’t spam! Read our privacy policy for more info.

You’ve been successfully subscribed to our newsletter!

Voted #1 at Stock Charts

SH Chart
Inverse S&P 500 Fund (SH) will have a Money Wave Buy today.

Help Us Help Animals

Help Us Help Animals

Recent Comments

  • Market Breadth Indicators: A Trader’s Guide to Early Trend Detection on Backtesting: Definition and How a Trading Strategy Backtest Works
  • Island Reversal Pattern: Definition and Formation Explained on Double Top Pattern: How to Identify and Trade This Reversal Signal
  • Channel Pattern Guide: What It Is and Why It Matters on A Guide to Forecasting Using Moving Averages
  • What Is a Broadening Bottom Chart Pattern? Full Guide on Bull vs. Bear Market: An Investor’s Guide to Market Phases
  • ATGL Weekly Money Flow - 2025-05-11 on ATGL Top Pick of the Week! Apr 6, 2025

Become a Green Liner!

Help me make more Money in the Stock Market.

ON ATGL

  • DashBoard
  • Weekly Commentary
  • Daily Buy / Sell Signals
  • Day Trade Setup
  • Trading Rooms

Design & Develop By Pixelvect

STRATEGIES

  • Swing Trading
  • ATGL Pick of the Week
  • Dividend Growth
  • ETF Sector Rotation
  • Dogs of the Dow

HELP

  • ATGL Trading Rules
  • FAQ
  • Account Maintenance
  • Contact US
  • Join

FOLLOW US

Instagram Linkedin Twitter Facebook

© COPYRIGHT 2024 · ABOVETHEGREENLINE.COM · ALL RIGHTS RESERVED · PRIVACY · TERMS · CONTACT · WATCHLIST · CURRENT