Above the Green Line -01
  • Market Insights
        • Commentary
          • Daily
          • Weekly
        • BUY / SELL SIGNALS
          • Trade Posts
          • Recent Trade Alerts
          • Recent Day Trades
        • BLOGROLL
          • Dividend Growth Blog
          • ETF Sector Blog
          • Dow Dogs
          • TPOW Blog
  • Strategies
        • SWING TRADING
          • Current Positions
          • Watchlists
          • Closed Positions
          • Candidates - TOP 100
          • Specialty Stocks
        • WEEKLY STOCK PICK
          • TPOW Charts
          • TPOW Performance
          • TPOW Strategy Guide
          • TPOW Performance Dashboard
        • DAY TRADING
          • Watch List
        • ATGL DASHBOARD
        • ETF STRATEGIES
          • ETF Sector Rotation
          • ETF Sector Portfolio
        • DIVIDEND GROWTH
          • Dividend Growth Portfolio
          • Dividend Calendar
        • DOGS OF THE DOW
          • Dogs of the Dow Portfolio
          • DOW 5 Portfolio
  • Markets
        • US MARKET
          • Commodities
          • Energy
          • Precious Metals
          • Volatility
        • GLOBAL MARKETS
          • Market Indices
          • Economic Calendar
          • FOREX Heat Map
          • FOREX Cross Rates
          • Crypto Currency Market
  • Investing
    • Discord Community
    • Dashboard
  • Resources
        • ARTICLES
          • Dividend Growth Model Articles
          • ETF Articles
          • Investment Strategies Articles
          • Market and Economic Insights
          • Stock Trade Articles
          • Stock Reviews
        • TOOLS
          • Stock Scanners
          • Charting Software
          • Brokerage Firms
        • STOCK CHARTS
          • Key Components
          • Reading Charts
          • Drawing Stock Charts
          • Identifying Trends
        • RETIREMENT PLANNING
  • About
    • Contact Us
    • How to Win
    • #1 At Stockcharts
    • Disclaimer
    • FAQ
  • Log In
  • Subscribe

January 24, 2022

Money Wave Alert! Jan 24, 2022

SPY Chart
The S&P 500 Index might have had a Selling Climax today when it tagged the Green Line on heavy Volume.

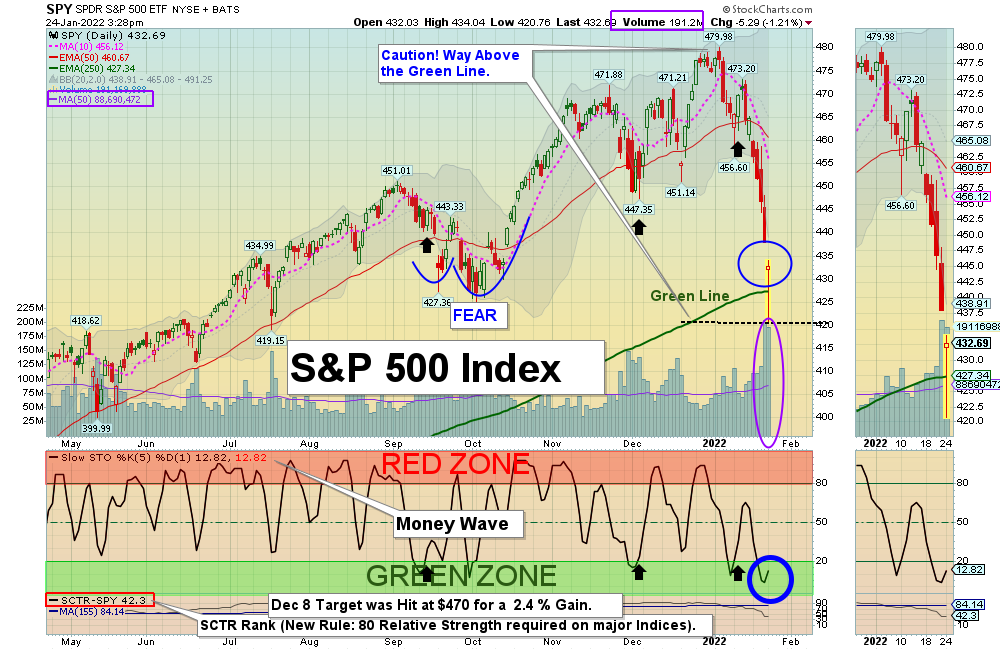
Markets were lower today as the S&P 500 Index dumped down Below the Green Line in the morning, and then bounced. Volume was huge as the Herd sold on bad news. This is called a “Selling Climax”, were we like to Buy soon.

Normally the Indices that made fresh New Highs recently like the S&P 500 and DOW 30 Indices will bounce up again to re-test the Highs. Weaker Investments might not get back up past the Red Lines (50-day avgs.) 

Markets might dip down once more tomorrow, and we have plenty of CASH to Buy soon. The Markets are adjusting for the FED no longer helping with Printing… 

New Subscribers: The WATCH LIST below is large which normally means that a rally is coming soon. This is one of the larger Sell Offs that you will see annually. Currently there are over 50 companies down in the Green Zones, but many are sector duplicates with lower Volume. Please WAIT for more Green Zone Buys. Money Wave pops work best when the S&P 500 Index is also in the Green Zone (Like NOW).

_________________________________________________________________________________________________________________

BUYS TODAY    1/24/2022    NONE TODAY

BUYS TOMORROW – JUMP START STOCKS  Shop for a better price earlier in the day. Only use Jump Start on the same day that a Daily Money Wave Buy Signal will occur.          

AEHR       AEHR TESTING SYSTEMS      Wait for Money Wave Close > 20 with High Volume.   

F      FORD MOTOR CO.      Wait for Money Wave Close > 20 with High Volume.       

FCG      NATURAL GAS FUND      Wait for Money Wave Close > 20 with High Volume.     

WFC     WELLS FARGO & CO.      Wait for Money Wave Close > 20 with High Volume. 

XLF      FINANCIAL FUND      Wait for Money Wave Close > 20 with High Volume.       

XLP      CONSUMER STAPLES FUND      Wait for Money Wave Close > 20 with High Volume. 

BUYS SOON – CHARTS      WATCH LIST

HPQ      HP INC.      Wait for Money Wave Close > 20 with High Volume.     

KRE      REGIONAL BANK FUND      Wait for Money Wave Close > 20 with High Volume. 

PFE      PFIZER INC.      Wait for Money Wave Close > 20 with High Volume.   

TSLA      TESLA INC.      Wait for Money Wave Close > 20 with High Volume. 

WFC     WELLS FARGO & CO.      Wait for Money Wave Close > 20 with High Volume. 

Please be patient and wait for Money Wave Buy Signals.  We will email you when they are ready. Follow on the WATCH LIST.      
The Leaders are Way Above the Green Lines (all Investments eventually return to their Green Lines).   

SELLS TODAY         

AMD      ADVANCED MICRO      Change to Long Term (Sell Stop Loss below the Green Line of $110.) The Money Wave is back down in the Green Zone.

UPST      UPSTART HOLDINGS     LOWER the Sell Stop Loss below $80 until it bottoms. The Money Wave is back down in the Green Zone.

_________________________________________________________________________________________________________________

DAY TRADING SETUPS.  Only two Triple Buy Pops today: M (+15%) VIX (+33%).  Try out the New Side by Side layout.   

DAY TRADING FOR INDICES & LARGE CAPS CHARTS.

Bonds  were lower today, and are Below the Green Line.     

Crude Oil was down $1.46 today at $83.50.

_________________________________________________________________________________________________________________

MY TRADING DASHBOARD 
SWING TRADING CURRENT POSITIONS
DAY TRADING SETUPS
TRADE ALERTS
ARE YOUR INVESTMENTS ABOVE THE GREEN LINE?
GREEN LINE RULES
ETF SECTOR ROTATION SYSTEM   
New TOP 100 LIST Updated Jan 1, 2022

Many like to Buy the Swing Trades just before the Close, if the Money Wave is going to create a Buy Signal (Closing > 20 and up out of the Green Zone).

Don’t Buy if the Investment has already popped up too much. Money Wave Buy Signals are usually good for a 3-6 %  move in a few days.

We will “Not Log” trades if the Reward/Risk is not at least 2:1, or Low Volume. These have more risk.

Related Post

– F

Subscribe to Our Newsletter

AGL Logo

Get our eBook Now!

Candlestick - A Swing Traders Friend

We don’t spam! Read our privacy policy for more info.

You’ve been successfully subscribed to our newsletter!

Voted #1 at Stock Charts

SH Chart
Inverse S&P 500 Fund (SH) will have a Money Wave Buy today.

Help Us Help Animals

Help Us Help Animals

Recent Comments

  • Market Breadth Indicators: A Trader’s Guide to Early Trend Detection on Backtesting: Definition and How a Trading Strategy Backtest Works
  • Island Reversal Pattern: Definition and Formation Explained on Double Top Pattern: How to Identify and Trade This Reversal Signal
  • Channel Pattern Guide: What It Is and Why It Matters on A Guide to Forecasting Using Moving Averages
  • What Is a Broadening Bottom Chart Pattern? Full Guide on Bull vs. Bear Market: An Investor’s Guide to Market Phases
  • ATGL Weekly Money Flow - 2025-05-11 on ATGL Top Pick of the Week! Apr 6, 2025

Become a Green Liner!

Help me make more Money in the Stock Market.

ON ATGL

  • DashBoard
  • Weekly Commentary
  • Daily Buy / Sell Signals
  • Day Trade Setup
  • Trading Rooms

Design & Develop By Pixelvect

STRATEGIES

  • Swing Trading
  • ATGL Pick of the Week
  • Dividend Growth
  • ETF Sector Rotation
  • Dogs of the Dow

HELP

  • ATGL Trading Rules
  • FAQ
  • Account Maintenance
  • Contact US
  • Join

FOLLOW US

Instagram Linkedin Twitter Facebook

© COPYRIGHT 2024 · ABOVETHEGREENLINE.COM · ALL RIGHTS RESERVED · PRIVACY · TERMS · CONTACT · WATCHLIST · CURRENT