Above the Green Line -01
  • Market Insights
        • Commentary
          • Daily
          • Weekly
        • BUY / SELL SIGNALS
          • Trade Posts
          • Recent Trade Alerts
          • Recent Day Trades
        • BLOGROLL
          • Dividend Growth Blog
          • ETF Sector Blog
          • Dow Dogs
          • TPOW Blog
  • Strategies
        • SWING TRADING
          • Current Positions
          • Watchlists
          • Closed Positions
          • Candidates - TOP 100
          • Specialty Stocks
        • WEEKLY STOCK PICK
          • TPOW Charts
          • TPOW Performance
          • TPOW Strategy Guide
          • TPOW Performance Dashboard
        • DAY TRADING
          • Watch List
        • ATGL DASHBOARD
        • ETF STRATEGIES
          • ETF Sector Rotation
          • ETF Sector Portfolio
        • DIVIDEND GROWTH
          • Dividend Growth Portfolio
          • Dividend Calendar
        • DOGS OF THE DOW
          • Dogs of the Dow Portfolio
          • DOW 5 Portfolio
  • Markets
        • US MARKET
          • Commodities
          • Energy
          • Precious Metals
          • Volatility
        • GLOBAL MARKETS
          • Market Indices
          • Economic Calendar
          • FOREX Heat Map
          • FOREX Cross Rates
          • Crypto Currency Market
  • Investing
    • Discord Community
    • Dashboard
  • Resources
        • ARTICLES
          • Dividend Growth Model Articles
          • ETF Articles
          • Investment Strategies Articles
          • Market and Economic Insights
          • Stock Trade Articles
          • Stock Reviews
        • TOOLS
          • Stock Scanners
          • Charting Software
          • Brokerage Firms
        • STOCK CHARTS
          • Key Components
          • Reading Charts
          • Drawing Stock Charts
          • Identifying Trends
        • RETIREMENT PLANNING
  • About
    • Contact Us
    • How to Win
    • #1 At Stockcharts
    • Disclaimer
    • FAQ
  • Log In
  • Subscribe

February 4, 2021

Money Wave Alert! Feb 4, 2021

GME Chart
GameStop Corp. (GME) has dropped $27 Billion in value from last week!

Sorry, the Charts are not loading well today from StockCharts.

Markets were higher today as the Indices need to make Higher Highs soon for this rally to continue. The Small Cap Fund (IWM) was the only major Index to make higher highs today. The bounces up from the Green Zones this time are extremely weak, indicating a lack of Buyers, so be cautious. The Retail Stocks that shot up last week have pulled back for trades soon. But most of the Leaders are now getting back up into the Red Zones (probably too late to Buy for the Short Term), and not many New Highs yet. 

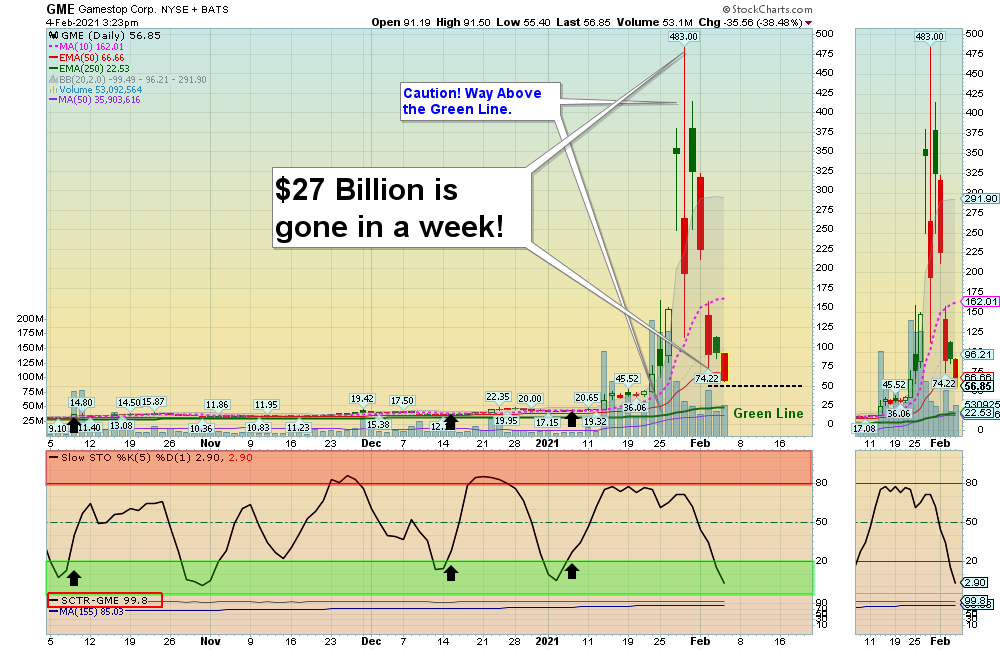
Most of the Leaders are Way Above the Green Lines. We are being conservative and only Buying Signals now if the Volume is High (at lease 1.25 X the 50-day avg. Volume). The better trades happen when the S&P 500 Index is also in the Green Zone (now back up in the Red Zone). 

Several new adds to the DAY TRADING SETUPS.

Bonds  were down again today, and are below the Green Line and a New Low.

Crude Oil was up $0.65 today at $56.34.

BUYS TODAY    2/4/2021   

M      MACY’S INC.         Money Wave Buy today.  M will not be logged as the Volume is below average of 30.3 MIL.

We will “Not Log” trades if the Reward/Risk is not at least 2:1.   

JUMP START: (Buy Signal should be very soon… Click on the Jump Start link for more info.)   

BB       BLACKBERRY LTD.     This was a Short Squeeze last week.   

SPWR      SUNPOWER CORP.

____________________________________________________________________________________________________________

WATCH LIST

WATCH LIST CHARTS (Real Time)     

BBBY      BED BATH & BEYOND    This was a Short Squeeze last week.       

GME      GAMESTOP CORP.  

SID      COMPANHIA SIDERURGICA SA      Buy above the Pink Line around $5.85 on High Volume with a 5 % Trailing Sell Stop Loss below it. 

XRT      RETAIL FUND

Money Wave Buys Signals Soon (3 Days-3 Weeks Short Term):   (Best to Buy the.se when the S&P 500 is also in the Green Zone.)       

These Investments will probably have a Money Wave Buy Signal soon. (Slow Stochastic Closing > 20) on today’s Close.      

Please be patient and wait for Money Wave Buy Signals.  We will email you when they are ready. Follow on the WATCH LIST.
Emotions are very high now, so please do not Buy unless you are VERY NIMBLE.

The Leaders are Way Above the Green Lines (all Investments eventually return to their Green Lines).

____________________________________________________________________________________________________________

SELLS TODAY  

IWM      SMALL CAP FUND     Target was Hit at $217 for a 3 % Gain. This trade was not logged.  

TAN        SOLAR FUND       EXIT if  it is going to Close below your Buy Price, or $115.89.  This trade was not logged.    

Click for  CURRENT POSITIONS  and adjust your Sell Stops.     

Click for  CURRENT POSITION CHARTS – Real Time  (Please check and adjust your Sell Stops).         
Click for  CLOSED POSITIONS,   
NEW:       MY TRADING DASHBOARD

DAY TRADING SETUPS
ARE YOUR INVESTMENTS ABOVE THE GREEN LINE?
ETF SECTOR ROTATION SYSTEM   
TOP 100 LIST Updated Jan 4, 2021

Many like to Buy the day before, near the Close, if the Money Wave is going to create a Buy Signal (Closing > 20 and out of the Green Zone).

Don’t Buy if the Investment has already popped up too much. Money Wave Buys are usually good for a 3-6 %  move in a few days.

We will “Not Log” trades if the Reward/Risk is not at least 2:1.     

Related Post

– Money Wave Alert! Feb 3, 2021

Subscribe to Our Newsletter

AGL Logo

Get our eBook Now!

Candlestick - A Swing Traders Friend

We don’t spam! Read our privacy policy for more info.

You’ve been successfully subscribed to our newsletter!

Voted #1 at Stock Charts

SH Chart
Inverse S&P 500 Fund (SH) will have a Money Wave Buy today.

Help Us Help Animals

Help Us Help Animals

Recent Comments

  • Market Breadth Indicators: A Trader’s Guide to Early Trend Detection on Backtesting: Definition and How a Trading Strategy Backtest Works
  • Island Reversal Pattern: Definition and Formation Explained on Double Top Pattern: How to Identify and Trade This Reversal Signal
  • Channel Pattern Guide: What It Is and Why It Matters on A Guide to Forecasting Using Moving Averages
  • What Is a Broadening Bottom Chart Pattern? Full Guide on Bull vs. Bear Market: An Investor’s Guide to Market Phases
  • ATGL Weekly Money Flow - 2025-05-11 on ATGL Top Pick of the Week! Apr 6, 2025

Become a Green Liner!

Help me make more Money in the Stock Market.

ON ATGL

  • DashBoard
  • Weekly Commentary
  • Daily Buy / Sell Signals
  • Day Trade Setup
  • Trading Rooms

Design & Develop By Pixelvect

STRATEGIES

  • Swing Trading
  • ATGL Pick of the Week
  • Dividend Growth
  • ETF Sector Rotation
  • Dogs of the Dow

HELP

  • ATGL Trading Rules
  • FAQ
  • Account Maintenance
  • Contact US
  • Join

FOLLOW US

Instagram Linkedin Twitter Facebook

© COPYRIGHT 2024 · ABOVETHEGREENLINE.COM · ALL RIGHTS RESERVED · PRIVACY · TERMS · CONTACT · WATCHLIST · CURRENT