Above The Green Line

  • Commentary
    • BUY / SELL SIGNALS
      • Stock Alerts
    • DIVGRO BLOG
    • ETF SECTOR BLOG
    • DOW DOGS BLOG
    • NEWS
    • STOCK IDEAS
  • Strategies
    • SWING TRADING
      • CURRENT POSITIONS
      • WATCHLISTS
      • CLOSED POSITIONS
      • CANDIDATES – TOP 100
      • SPECIALTY STOCKS
    • DAY TRADING
      • Watch List
    • DIVIDEND GROWTH
      • Dividend Growth Portfolio
      • Dividend Calendar
    • DOGS OF THE DOW
      • Dogs of the Dow Portfolio
      • DOW 5 Portfolio
    • ETF SECTOR ROTATION
      • ETF Sector Portfolio
  • Markets
    • US MARKET
      • Commodities
      • Energy
      • Precious Metals
      • Volatility
    • GLOBAL MARKETS
      • MARKET INDICES
      • ECONOMIC CALENDAR
      • FOREX HEAT MAP
      • FOREX CROSS RATES
      • CRYPTOCURRENCY MARKET
    • DASHBOARD
    • IDEAS
  • Investing
    • FORUM
  • Resources
    • ARTICLES
    • WEEKLY STOCK
    • RETIREMENT PLANNING
    • BLOGROLL
    • FAQ
  • About
    • CONTACT US
    • HOW TO WIN
    • #1 AT STOCKCHARTS
  • Log In
  • Subscribe

February 11, 2022

Money Wave Alert! Feb 11, 2022

BTU Chart
The Target was Hit on Peabody Energy (BTU) at $16 for a 41% Gain.

Markets were lower again today, as the Indices are going back down to re-test the lows of January. The less that the Markets go down this time, the stronger that the next up rally should be. The very strongest Leaders like the Financials & Energy are coming down from the Red Zones (probably too late to Buy for the Short term). We are waiting on more Investments to return to the Green Zones for Money Wave Buy Signals soon.

The stronger DOW 30 and S&P 500 Indices were too over-bought last week to Close above Resistance of the Red Lines (50-day avgs). Normally the Indices that made fresh New Highs in January like the S&P 500 and DOW 30 Indices should  re-test the Highs if this current decline ends soon. Weaker Investments might not get back up past the Red Lines (50-day avgs.)

New Subscribers:  There are only 3 Stocks in the Green Zones, so please WAIT for more Money Wave Buy Signals soon. Money Wave pops work best when the S&P 500 Index is just coming up out of the Green Zone.

_________________________________________________________________________________________________________________

BUYS TODAY    2/11/2022    NONE TODAY


BUYS TOMORROW – JUMP START STOCKS  Shop for a better price earlier in the day. Only use Jump Start on the same day that a Daily Money Wave Buy Signal will occur.       

AR      ANTERO RECOURCES CORP.      Buy above $20.14 with High Volume with a 5% Trailing Sell Stop Loss below it.

BUYS SOON – CHARTS      WATCH LIST

SARK      INVERSE SMALL CAP FUND      Money Wave must Close in the Green Zone.   

XLK      TECH FUND      Money Wave must Close in the Green Zone.      

Please be patient and wait for Money Wave Buy Signals.  We will email you when they are ready. Follow on the WATCH LIST.      
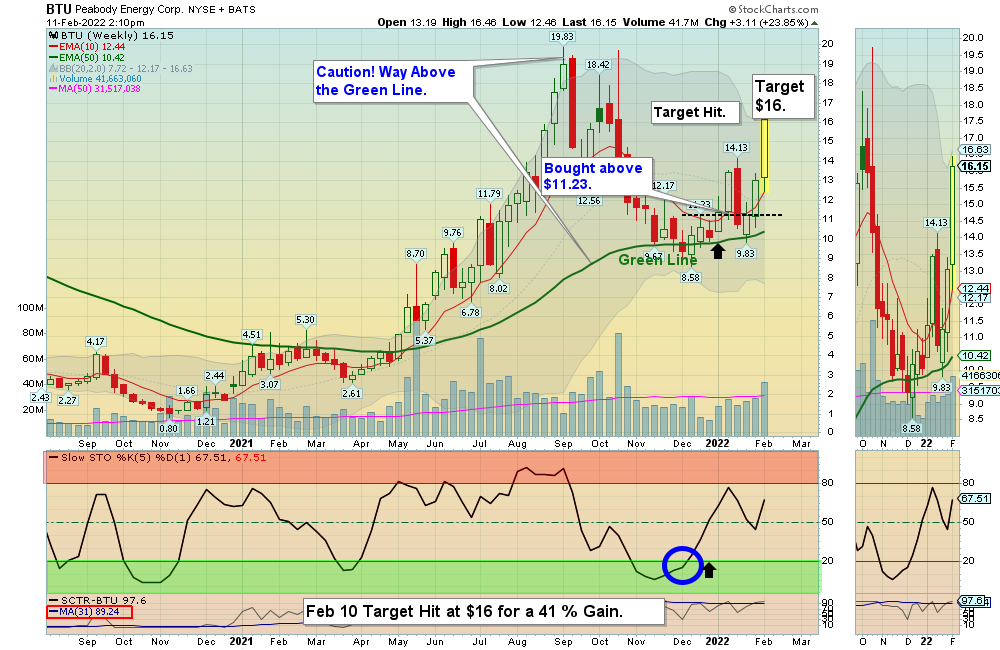
The Leaders are Way Above the Green Lines (all Investments eventually return to their Green Lines). 

SELLS TODAY       

BTU      PEABODY ENERGY      The Target was Hit at $16 for a 41% Gain (Long Term Portfolio).   

HPQ      HEWETT PACKARD       EXIT if it is going to Close below the Pink Line around $37.70. The Target was already Hit for an 8.6 % Gain.

KSS      KOHLS CORP.      Slipped below the Buy Price and was Stopped Out even. (Don’t Take a Loss!) This trade was not logged.     

XLF      FINANCIAL FUND      EXIT if it is going to Close below the Pink Line around $40.08. The Target was already Hit for an 6.6 % Gain.

_________________________________________________________________________________________________________________

DAY TRADING SETUPS.  A few Triple Buy Pops today: CFVI (+6%) SQQQ (+9%)  & VXX (+14%).  Try out the New Side by Side layout.   

DAY TRADING FOR INDICES & LARGE CAPS CHARTS.

Bonds  were down again today, and are Below the Green Line.     

Crude Oil was up $3.40 today at $93.40 (New High).

_________________________________________________________________________________________________________________

MY TRADING DASHBOARD 
SWING TRADING CURRENT POSITIONS
DAY TRADING SETUPS
TRADE ALERTS
ARE YOUR INVESTMENTS ABOVE THE GREEN LINE?
GREEN LINE RULES
ETF SECTOR ROTATION SYSTEM   
New TOP 100 LIST Updated Feb 1, 2022

Many like to Buy the Swing Trades just before the Close, if the Money Wave is going to create a Buy Signal (Closing > 20 and up out of the Green Zone).

Don’t Buy if the Investment has already popped up too much. Money Wave Buy Signals are usually good for a 3-6 %  move in a few days.

We will “Not Log” trades if the Reward/Risk is not at least 2:1, or Low Volume. These have more risk.   


HAVE A NICE WEEKEND!

Posted By AbovetheGreenLine at 2:40 pm 2 Comments Tagged With: premium

Comments

  1. Allenrx93 says

    February 11, 2022 at 3:15 pm

    Question with long term signals. Do we get the signals when to buy long term stocks on the watch list. I saw the sell order today for Peabody but do not remember seeing the buy signal.
    Please advise
    Allen

    Log in to Reply
    • AbovetheGreenLine says

      February 11, 2022 at 4:16 pm

      Hi Allen. We don’t have a good Buy Signal for the Long Term Investments. Normally we would use the Weekly Money Wave Closing > 20.
      But many times the Investment will already be up 10% + for the week, before we get a Weekly Close Buy Signal.

      So now we wait for the next Daily Money Wave Buy Signal with High Volume. But there has not been much High Volume Buying in months.

      After a 13 Year Bull Market, there are probably not many good Long Term Buys except for Investments that will go up with Higher Interest Rates and Inflation. And many of those are not in Bull Markets yet.

      Currently we are Buying the Leaders when they pull back to the Green Line and still have 80 Relative Strength. They can bang around for a few weeks before they decide to bounce up at the Green Line or not. So follow the Watch List Charts – Long Term and if you like any of them, Buy them near the Green Line with a Stop slightly below. If they bounce, it is usually good for 10-20% in a few weeks.

      Thanks for writing!

      ATGL
      XLK Chart

      Log in to Reply

Leave a Reply Cancel reply

You must be logged in to post a comment.

Voted #1 at Stock Charts

SH Chart
Inverse S&P 500 Fund (SH) will have a Money Wave Buy today.

Help Us Help Animals

Help Us Help Animals

Recent Comments

  • psychess on Green Line Weekly Jun 4, 2023
  • AbovetheGreenLine on Money Wave Alert! May 19, 2023
  • Robert Zieman on Money Wave Alert! May 19, 2023
  • Volodymyr Gelfand on Monet Wave Alert! May, 18, 2023
  • Money Wave Alert! May 16, 2023 – InvFuture Education on Money Wave Alert! May 16, 2023

Become a Green Liner!

Help me make more Money in the Stock Market.

Above the Green Line

ON ATGL

  • Weekly Commentary
  • Intraday Buy / Sells
  • Day Trade Setup

STRATEGIES

  • Swing Trading
  • Dividend Growth
  • ETF Sector Rotation
  • Dogs of the Dow

HELP

  • ATGL Trading Rules
  • FAQ
  • Account Maintenance
  • Contact US

© Copyright 2021 · AboveTheGreenLine.com · All Rights Reserved · Privacy · Terms · Contact · WatchList · Current