Above The Green Line

  • Commentary
    • BUY / SELL SIGNALS
      • Stock Alerts
    • DIVGRO BLOG
    • ETF SECTOR BLOG
    • DOW DOGS BLOG
    • NEWS
    • STOCK IDEAS
  • Strategies
    • SWING TRADING
      • CURRENT POSITIONS
      • WATCHLISTS
      • CLOSED POSITIONS
      • CANDIDATES – TOP 100
      • SPECIALTY STOCKS
    • DAY TRADING
      • Watch List
    • DIVIDEND GROWTH
      • Dividend Growth Portfolio
      • Dividend Calendar
    • DOGS OF THE DOW
      • Dogs of the Dow Portfolio
      • DOW 5 Portfolio
    • ETF SECTOR ROTATION
      • ETF Sector Portfolio
  • Markets
    • US MARKET
      • Commodities
      • Energy
      • Precious Metals
      • Volatility
    • GLOBAL MARKETS
      • MARKET INDICES
      • ECONOMIC CALENDAR
      • FOREX HEAT MAP
      • FOREX CROSS RATES
      • CRYPTOCURRENCY MARKET
    • DASHBOARD
    • IDEAS
  • Investing
    • FORUM
  • Resources
    • ARTICLES
    • WEEKLY STOCK
    • RETIREMENT PLANNING
    • BLOGROLL
    • FAQ
  • About
    • CONTACT US
    • HOW TO WIN
    • #1 AT STOCKCHARTS
  • Log In
  • Subscribe

February 1, 2022

Money Wave Alert! Feb 1, 2022

DIA Chart
The DOW 30 Index should have Resistance near the Red Line (50-day avg.)

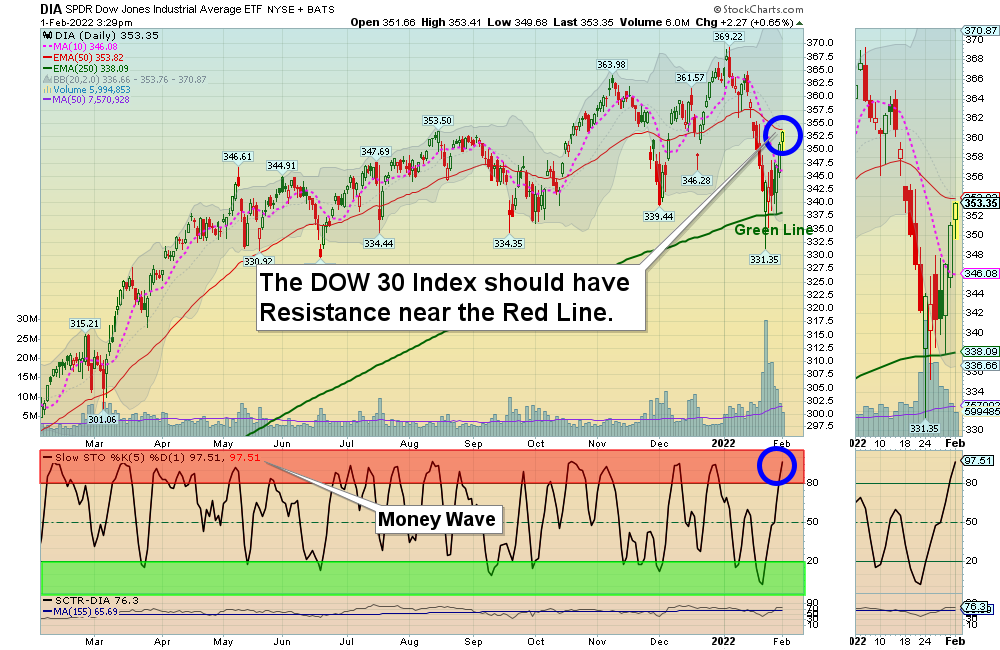
Markets were higher again today on mild Buying. The Volume is slowing down from lack of Buyers at this level. The stronger DOW 30 and S&P 500 Indices should have Resistance near the Red Lines (50-day avgs). The Techs are having some profit taking today. This rally up should have 5 Waves in it (3 up waves and 2 down) and the first wave up could be over soon. 

Normally the Indices that made fresh New Highs recently like the S&P 500 and DOW 30 Indices should bounce up again to re-test the Highs. Weaker Investments might not get back up past the Red Lines (50-day avgs.)

Last year’s Darling ARK Innovations Fund (ARKK) is now in a Bear Market, but the Fund just had a 19% “dead cat bounce” from being extremely over-sold. Normally the fund will re-test the recent Low, and someone has created an Inverse Fund called SARK, which does the opposite of the weak ARKK Fund. SARK is now on the Watch List as it made a recent New High with 95 Relative Strength. This Inverse Fund should show you how there should always be Investments that meet the Green Line Rules, no matter if the Market are Bull or Bear. 

New Subscribers: Please WAIT for more Money Wave Buy Signals soon. The S&P 500 has just popped up 7 % from last Monday’s Low. Money Wave pops work best when the S&P 500 Index is just coming out of the Green Zone.

_________________________________________________________________________________________________________________

BUYS TODAY    2/1/2022    

BLDR      BUILDERS FIRSTSOURCE    Moved up above the Pink Line today, but BLDR will not be Bought or Logged as the Volume is below average of 2.9 MIL.

IMTE      INTEGRATED MEDIA    Money Wave Buy today but IMTE will not be Bought or Logged today as it is already up 6 % today on low Volume.

We will “Not Log” trades if the Reward/Risk is not at least 2:1, or Low Volume. These have more risk.   

BUYS TOMORROW – JUMP START STOCKS  Shop for a better price earlier in the day. Only use Jump Start on the same day that a Daily Money Wave Buy Signal will occur.    

SARK      INVERSE ARK INNOVATION FUND      Wait for Money Wave Close > 20 with High Volume.     

BUYS SOON – CHARTS      WATCH LIST

F      FORD MOTOR CO.      Buy above $21.04 with High Volume with a 5% Trailing Sell Stop Loss below it.  

Please be patient and wait for Money Wave Buy Signals.  We will email you when they are ready. Follow on the WATCH LIST.      
The Leaders are Way Above the Green Lines (all Investments eventually return to their Green Lines). 

SELLS TODAY     NONE TODAY     

AEHR      AEHR TEST SYSTEMS      EXIT on the Close today, or have a tight Sell Stop below it to capture a quick 12.5% Gain. We are maxed out at 10 Logged Positions and want to raise some Cash.

_________________________________________________________________________________________________________________

DAY TRADING SETUPS.  Several Triple Buy Pops today: AMC (+12%) BFRI (+25%) DWAC (+12%) LVGN (+8%) & PHUN (+7%).  Try out the New Side by Side layout.   

DAY TRADING FOR INDICES & LARGE CAPS CHARTS.

Bonds  were lower today, and are Below the Green Line.     

Crude Oil was up $0.01 today at $88.16, a New High.

_________________________________________________________________________________________________________________

MY TRADING DASHBOARD 
SWING TRADING CURRENT POSITIONS
DAY TRADING SETUPS
TRADE ALERTS
ARE YOUR INVESTMENTS ABOVE THE GREEN LINE?
GREEN LINE RULES
ETF SECTOR ROTATION SYSTEM   
New TOP 100 LIST Updated Feb 1, 2022

Many like to Buy the Swing Trades just before the Close, if the Money Wave is going to create a Buy Signal (Closing > 20 and up out of the Green Zone).

Don’t Buy if the Investment has already popped up too much. Money Wave Buy Signals are usually good for a 3-6 %  move in a few days.

We will “Not Log” trades if the Reward/Risk is not at least 2:1, or Low Volume. These have more risk.   

Posted By AbovetheGreenLine at 2:48 pm 2 Comments Tagged With: premium

Comments

  1. craig shavlik says

    February 1, 2022 at 3:19 pm

    Question about your EW 5 step process….you mention we are probably near the end of phase one…what indicators would you be looking at to signal that end….and secondly do you still see the markets much lower than this bounce and consider this a bear market bounce or are you in the camp that the correction is over….there seems to be two distinct groups out there…thanks

    Log in to Reply
    • AbovetheGreenLine says

      February 1, 2022 at 3:53 pm

      Hi Craig. The S&P 500 should have 5 smaller Waves back up to re-test the Highs.

      Wave 1 might be almost over because the Daily S&P Chart is back up in the Red Zone.
      Wave 2 usually gives up 1/2 to 5/8 of Wave 1 up.
      Wave 3 is the Big Power Wave and might make it back to the High.
      Wave 4 is normal profit taking and gives up about 3/8 of Wave 3.
      Wave 5 can make a New High, but Volume and breadth are poor as Smart Money is getting out…

      This is normal Human Behavior, studied by Italian mathematician Fibonacci.

      Expecting further upside after the Longest Bull in history and without a “sugar high” of Printing from the FED does not sound great for historically over priced Stocks.

      Smart Money and the Green Line will go elsewhere. Will you?

      SPX CHART

      Log in to Reply

Leave a Reply Cancel reply

You must be logged in to post a comment.

Voted #1 at Stock Charts

SH Chart
Inverse S&P 500 Fund (SH) will have a Money Wave Buy today.

Help Us Help Animals

Help Us Help Animals

Recent Comments

  • Green Line Weekly! Aug 7, 2022 – ParkRiver on Green Line Weekly! Aug 7, 2022
  • AbovetheGreenLine on Money Wave Alert! Aug 5, 2022
  • merryme on Money Wave Alert! Aug 5, 2022
  • AbovetheGreenLine on Target was Hit on CTIC for an 8.9% Gain.
  • SlippinJimmy on Target was Hit on CTIC for an 8.9% Gain.

Become a Green Liner!

Help me make more Money in the Stock Market.

Above the Green Line

ON ATGL

  • Weekly Commentary
  • Intraday Buy / Sells
  • Day Trade Setup

STRATEGIES

  • Swing Trading
  • Dividend Growth
  • ETF Sector Rotation
  • Dogs of the Dow

HELP

  • ATGL Trading Rules
  • FAQ
  • Account Maintenance
  • Contact US

© Copyright 2021 · AboveTheGreenLine.com · All Rights Reserved · Privacy · Terms · Contact · WatchList · Current