
Watchlist and Charts to Buy Soon.
| Daily Swing Watch List | Daily Swing Charts to Buy |
| Current Swing Positions | Current Swing Charts |
| Closed Results | Trading Dashboard |
Current Pick and Chart
| Top Pick of the Week | TPOW Stock Chart |
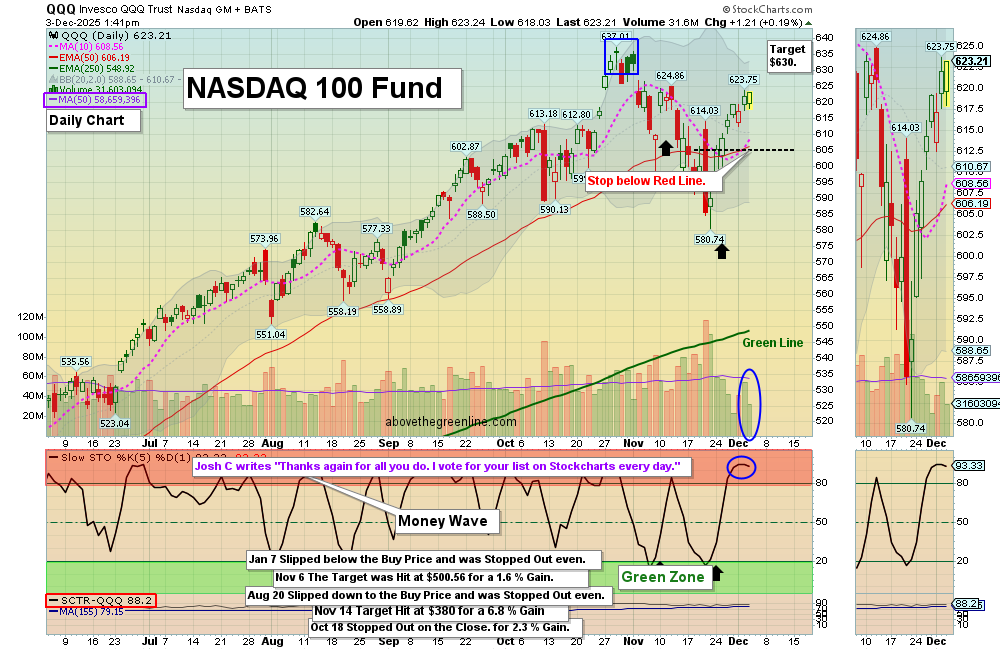
Dec 3, 2025 Today the markets opened on a weaker side, but SPY still managed to hold and slowly grind back toward its previous highs for either an M pattern or a potential higher high. GDX also pushed upward for a possible retest of its earlier highs, while the broader market remained in a critical deciding phase, with most leaders still elevated in the red zone.
Biotech Fund XBI continued to hold its levels well and remained one of the strongest funds in the current environment. The day ended with no new swing buys, as SPY and QQQ stayed overbought and the best swing entries typically occur when large caps return to the green zone.
Wait for more Buy Signals coming up out of the Green Zones. WATCH LIST CHARTS
The best moves happen when the S&P 500 Index is also coming up out of the Green Zone.
______________________________________________________________________________
DAILY SWING BUYS TODAY 12/03/2025 NONE TODAY
BUYS SOON
| Open Date | Symbol | Description | Industry | SCTR | Size | Last Price | Daily Change % | Comments | ATGL 60 Min | id | Strategy | Position | Sell Date | Sell Price | Purchase Price | Net Profit | Realized Gain/Loss % | ATGL Rule | Stop Loss | color | Chart | Update Date | Status | Unrealized Gain/Loss % | Volume | Post Type | # Shares | Amount Invested | Portfolio Weight | Dividend Rate | Current Yield | Current Value | Yield on Cost | Projected Annual Dividends | Total Dividends Received | Pay Back | Profit / Loss | Annualized Profit/Loss | Star Rating | Target Price | News Alert % | Target Triggered |
|---|---|---|---|---|---|---|---|---|---|---|---|---|---|---|---|---|---|---|---|---|---|---|---|---|---|---|---|---|---|---|---|---|---|---|---|---|---|---|---|---|---|---|
| 2026-04-10 | TYRA | Tyra Biosciences inc. | HealthCare | 97 | Small | $35.26 | -3.8975 | Wait for next Daily Money Wave Close > 20 with High Volume. | 5028 | Short Term | Long | $0.00 | 0.00% | https://stockcharts.com/sc3/ui/?s=TYRA&a=2237414123&p=D&yr=0&mn=4&dy=0&id=p57025057207 | 2026-04-10 19:13:08 | open | 0.00% | 875343 | Watch List | $0 | 0.00% | 0.00 | 0 | $0 | 0.00% | $0 | $0 | 0.00% | 0.00% | - | $39.50 | |||||||||||
| 2026-04-09 | BITI | Inverse Bit-Coin Fund | Financial | 97 | ETF | $24.07 | -1.5542 | Wait for next Daily Money Wave Close > 20 with High Volume. | 5027 | Short Term | Long | $0.00 | 0.00% | https://stockcharts.com/sc3/ui/?s=BITI&a=1389298524&p=D&yr=0&mn=6&dy=0&id=p81129401835 | 2026-04-09 18:14:31 | open | 0.00% | 1106667 | Watch List | $0 | 0.00% | 0.00 | 0 | $0 | 0.00% | $0 | $0 | 0.00% | 0.00% | - | $27.00 | |||||||||||
| 2026-04-08 | IBRX | Immunity Bio | HealthCare | 98 | Small | $7.28 | -2.6738 | Money Wave Must Close in the Green Zone. | 5026 | Short Term | Long | $0.00 | 0.00% | https://stockcharts.com/sc3/ui/?s=IBRX&a=1641751294&p=D&yr=0&mn=4&dy=0&id=p13018070080 | 2026-04-08 18:52:56 | open | 0.00% | 14365657 | Watch List | $0 | 0.00% | 0.00 | 0 | $0 | 0.00% | $0 | $0 | 0.00% | 0.00% | - | $10.50 |
Shop for a better price earlier in the day with Green Candle Buy Signal, on the same day that a Daily Money Wave Buy Signal will occur.
Many like to Buy the Swing Trades just before the Close, if the Money Wave is going to create a Buy Signal (Closing > 20 and up out of the Green Zone). Don’t Buy if the Security has already popped up too much. Money Wave Buy Signals are usually good for a 3-6 % move in a few days.
DAILY SWING SELLS TODAY
STX Seagate Tech. Slipped down to the Buy Price and was stopped Out even.
________________________________________________________________________
WEEKLY SWING TRADE POPS NONE TODAY
WEEKLY SWING TRADING (Formerly LONG TERM)Watchlist and Charts to Buy Soon.
| Weekly Swing Watch List | Weekly Swing Charts to Buy |
| Current Weekly Positions | Current Weekly Charts |
| Closed Results | Stage Chart Investing |
DAY TRADING SETUPS. Today we had 12 scalp trades for nice Gains at our Trading Room. In this Emotional Market now, Day Trading Alerts are not being sent out on our Discord Site with Live Chatting. Please install Discord app on your PC or cell for mobile notifications. Check out our Live Stream.
Or look for Green Candle Buy Pops (Red Candle turns Green). Big Movers today: ARWR + 12% CGTX +11% & AEVA+24%.
Bonds were up today and are Above the Green Line.
Crude Oil was up $0.42 today at $59.05.
NEW! TOP PICK OF THE WEEK
MY TRADING DASHBOARD
SWING TRADING CURRENT POSITIONS
DAY TRADING SETUPS
TRADE ALERTS
STAGE CHART INVESTING
TOP 100 STOCKS
PREVIOUS GREEN LINE STOCKS