
Watchlist and Charts to Buy Soon.
| Daily Swing Watch List | Daily Swing Charts to Buy |
| Current Swing Positions | Current Swing Charts |
| Closed Results | Trading Dashboard |
Current Pick and Chart
| Top Pick of the Week | TPOW Stock Chart |
Top Pick of the Week: Intel Corp. $INTC was kept from the previous week and will be Sold on the Close Friday.
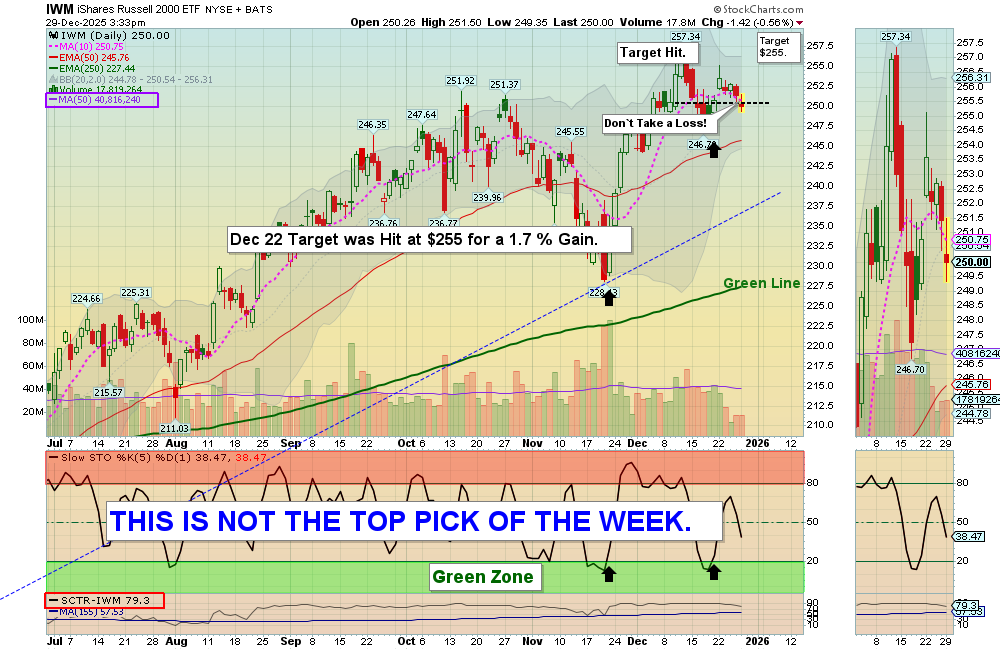
Dec 29, 2025 Today we saw that markets opened on a bearish note, with SPY gapping down at the open. Small caps like IWM remained quiet with limited buyer participation, and overall market action lacked volatility and meaningful volume as the year-end approached. Many Stocks that are down from this year’s high are being sold this week for TAX LOSSES…
Silver and Gold also retraced and opened with gap-down moves, reflecting softer risk appetite. Inverse funds such as SH rose steadily, while we continued to hold INTC as our TPOW, and the day ultimately ended on a weaker note with low volume.
Wait for more Buy Signals coming up out of the Green Zones. WATCH LIST CHARTS
The best moves happen when the S&P 500 Index is also coming up out of the Green Zone.
______________________________________________________________________________
BUYS TODAY 12/29/2025 NONE TODAY
BUYS SOON
| Open Date | Symbol | Description | Industry | SCTR | Size | Last Price | Daily Change % | Comments | ATGL 60 Min | id | Strategy | Position | Sell Date | Sell Price | Purchase Price | Net Profit | Realized Gain/Loss % | ATGL Rule | Stop Loss | color | Chart | Update Date | Status | Unrealized Gain/Loss % | Volume | Post Type | # Shares | Amount Invested | Portfolio Weight | Dividend Rate | Current Yield | Current Value | Yield on Cost | Projected Annual Dividends | Total Dividends Received | Pay Back | Profit / Loss | Annualized Profit/Loss | Star Rating | Target Price | News Alert % | Target Triggered |
|---|---|---|---|---|---|---|---|---|---|---|---|---|---|---|---|---|---|---|---|---|---|---|---|---|---|---|---|---|---|---|---|---|---|---|---|---|---|---|---|---|---|---|
| 2026-03-30 | PL | Planet Labs PBC | AeroSpace | 99 | Small | $30.71 | 9.8748 | Wait for next Daily Money Wave Close > 20 with High Volume. | 5013 | Short Term | Long | $0.00 | 0.00% | https://stockcharts.com/sc3/ui/?s=PL&a=1911743149&p=D&yr=0&mn=4&dy=0&id=p74921219280 | 2026-03-30 18:17:07 | open | 0.00% | 17344355 | Watch List | $0 | 0.00% | 0.00 | 0 | $0 | 0.00% | $0 | $0 | 0.00% | 0.00% | - | $34.00 | |||||||||||
| 2026-03-30 | NOK | Nokia Corp. | Telecom | 94 | $8.27 | 2.8607 | Money Wave Must Close in the Green Zone. | 5014 | Short Term | Long | $0.00 | 0.00% | https://stockcharts.com/sc3/ui/?s=NOK&a=629278732&p=D&yr=0&mn=6&dy=0&id=p46320196513 | 2026-04-01 00:04:19 | open | 0.00% | 59809908 | Watch List | $0 | 0.00% | 0.00 | 0 | $0 | 0.00% | $0 | $0 | 0.00% | 0.00% | - | $8.50 | ||||||||||||
| 2026-03-24 | MU | Micron Tech. | Semiconductor | 98 | Large | $367.85 | 8.8829 | Wait for next Daily Money Wave Close > 20 with High Volume. | 5008 | Short Term | Long | $0.00 | 0.00% | https://stockcharts.com/sc3/ui/?s=MU&a=1659646208&p=D&yr=0&mn=4&dy=0&id=p30932029130 | 2026-03-24 16:38:04 | open | 0.00% | 74852100 | Watch List | $0 | 0.00% | 0.50 | 0.1346 | $0 | 0.00% | $0 | $0 | 0.00% | 0.00% | - | $450.00 |
Shop for a better price earlier in the day with Green Candle Buy Signal, on the same day that a Daily Money Wave Buy Signal will occur.
Many like to Buy the Swing Trades just before the Close, if the Money Wave is going to create a Buy Signal (Closing > 20 and up out of the Green Zone). Don’t Buy if the Security has already popped up too much. Money Wave Buy Signals are usually good for a 3-6 % move in a few days.
DAILY SWING SELLS TODAY
SMH Semiconductor Fund Gapped Down to $362.65 for a 1.8 % Gain.
________________________________________________________________________
WEEKLY SWING TRADE POPS NONE TODAY
WEEKLY SWING TRADING (Formerly LONG TERM)Watchlist and Charts to Buy Soon.
| Weekly Swing Watch List | Weekly Swing Charts to Buy |
| Current Weekly Positions | Current Weekly Charts |
| Closed Results | Stage Chart Investing |
DAY TRADING SETUPS. Today we had 9 scalp trades for nice Gains at our Trading Room. In this Emotional Market now, Day Trading Alerts are not being sent out on our Discord Site with Live Chatting. Please install Discord app on your PC or cell for mobile notifications. Check out our Live Stream.
Or look for Green Candle Buy Pops (Red Candle turns Green). Big Movers today: YANG+ 5% PGEN +8% & BOIL + 5%.
Bonds were up today and are Above the Green Line.
Crude Oil was up $1.38 today at $58.11.
NEW! TOP PICK OF THE WEEK
MY TRADING DASHBOARD
SWING TRADING CURRENT POSITIONS
DAY TRADING SETUPS
TRADE ALERTS
STAGE CHART INVESTING
TOP 100 STOCKS
PREVIOUS GREEN LINE STOCKS