
Watchlist and Charts to Buy Soon.
| Daily Swing Watch List | Daily Swing Charts to Buy |
| Current Swing Positions | Current Swing Charts |
| Closed Results | Trading Dashboard |
Current Pick and Chart
| Top Pick of the Week | TPOW Stock Chart |
The Top Pick of the Week: Oklo Inc. $OKLO was Sold today, as it reached the 4% target for conservative investors and 8 % for Aggressive investors).
Dec 2, 2025 Today the markets opened on a mixed note, with SPY spending most of the session slowly grinding toward the upside and holding steady strength. TLT bonds dipped further and finally met their real value at the bananas line, while UNG also touched its daily green line, the fair-value zone with no emotional premium.
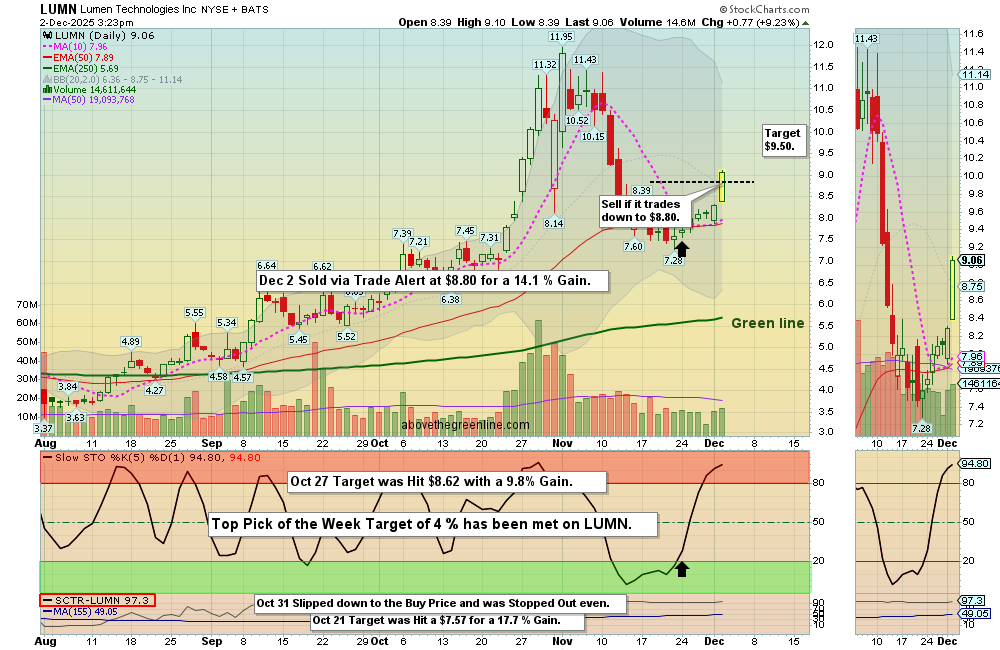
We secured another 4% conservative target on our TPOW this week with OKLO, and our daily swing target was hit on LUMN, sold via Trade Alert for a solid 14.1% gain. Silver continued to be one of the strongest performers of the day. Overall, the session ended on a positive and steady note.
Wait for more Buy Signals coming up out of the Green Zones. WATCH LIST CHARTS
The best moves happen when the S&P 500 Index is also coming up out of the Green Zone.
______________________________________________________________________________
DAILY SWING BUYS TODAY 12/02/2025 NONE TODAY
BUYS SOON
| Open Date | Symbol | Description | Industry | SCTR | Size | Last Price | Daily Change % | Comments | ATGL 60 Min | id | Strategy | Position | Sell Date | Sell Price | Purchase Price | Net Profit | Realized Gain/Loss % | ATGL Rule | Stop Loss | color | Chart | Update Date | Status | Unrealized Gain/Loss % | Volume | Post Type | # Shares | Amount Invested | Portfolio Weight | Dividend Rate | Current Yield | Current Value | Yield on Cost | Projected Annual Dividends | Total Dividends Received | Pay Back | Profit / Loss | Annualized Profit/Loss | Star Rating | Target Price | News Alert % | Target Triggered |
|---|---|---|---|---|---|---|---|---|---|---|---|---|---|---|---|---|---|---|---|---|---|---|---|---|---|---|---|---|---|---|---|---|---|---|---|---|---|---|---|---|---|---|
| 2026-04-10 | TYRA | Tyra Biosciences inc. | HealthCare | 97 | Small | $35.26 | -3.8975 | Wait for next Daily Money Wave Close > 20 with High Volume. | 5028 | Short Term | Long | $0.00 | 0.00% | https://stockcharts.com/sc3/ui/?s=TYRA&a=2237414123&p=D&yr=0&mn=4&dy=0&id=p57025057207 | 2026-04-10 19:13:08 | open | 0.00% | 875343 | Watch List | $0 | 0.00% | 0.00 | 0 | $0 | 0.00% | $0 | $0 | 0.00% | 0.00% | - | $39.50 | |||||||||||
| 2026-04-09 | BITI | Inverse Bit-Coin Fund | Financial | 97 | ETF | $24.07 | -1.5542 | Wait for next Daily Money Wave Close > 20 with High Volume. | 5027 | Short Term | Long | $0.00 | 0.00% | https://stockcharts.com/sc3/ui/?s=BITI&a=1389298524&p=D&yr=0&mn=6&dy=0&id=p81129401835 | 2026-04-09 18:14:31 | open | 0.00% | 1106667 | Watch List | $0 | 0.00% | 0.00 | 0 | $0 | 0.00% | $0 | $0 | 0.00% | 0.00% | - | $27.00 | |||||||||||
| 2026-04-08 | IBRX | Immunity Bio | HealthCare | 98 | Small | $7.28 | -2.6738 | Money Wave Must Close in the Green Zone. | 5026 | Short Term | Long | $0.00 | 0.00% | https://stockcharts.com/sc3/ui/?s=IBRX&a=1641751294&p=D&yr=0&mn=4&dy=0&id=p13018070080 | 2026-04-08 18:52:56 | open | 0.00% | 14365657 | Watch List | $0 | 0.00% | 0.00 | 0 | $0 | 0.00% | $0 | $0 | 0.00% | 0.00% | - | $10.50 |
Shop for a better price earlier in the day with Green Candle Buy Signal, on the same day that a Daily Money Wave Buy Signal will occur.
Many like to Buy the Swing Trades just before the Close, if the Money Wave is going to create a Buy Signal (Closing > 20 and up out of the Green Zone). Don’t Buy if the Security has already popped up too much. Money Wave Buy Signals are usually good for a 3-6 % move in a few days.
DAILY SWING SELLS TODAY
LUMN Lumen Technologies Inc. Sold at $8.80 via Trade Alert for a 14.1 % Gain.
MAGS Magnificent Seven ETF. Sold at $67 via Trade Alert for a 5.6 % Gain.
________________________________________________________________________
WEEKLY SWING TRADE POPS NONE TODAY
WEEKLY SWING TRADING (Formerly LONG TERM)Watchlist and Charts to Buy Soon.
| Weekly Swing Watch List | Weekly Swing Charts to Buy |
| Current Weekly Positions | Current Weekly Charts |
| Closed Results | Stage Chart Investing |
DAY TRADING SETUPS. Today we had 17 scalp trades for nice Gains at our Trading Room. In this Emotional Market now, Day Trading Alerts are not being sent out on our Discord Site with Live Chatting. Please install Discord app on your PC or cell for mobile notifications. Check out our Live Stream.
Or look for Green Candle Buy Pops (Red Candle turns Green). Big Movers today: OKLO + 10% LUMN +12% & TMC+15%.
Bonds were up today and are Above the Green Line.
Crude Oil was down $0.70 today at $58.62.
NEW! TOP PICK OF THE WEEK
MY TRADING DASHBOARD
SWING TRADING CURRENT POSITIONS
DAY TRADING SETUPS
TRADE ALERTS
STAGE CHART INVESTING
TOP 100 STOCKS
PREVIOUS GREEN LINE STOCKS