Above the Green Line -01
  • Market Insights
        • Commentary
          • Daily
          • Weekly
        • BUY / SELL SIGNALS
          • Trade Posts
          • Recent Trade Alerts
          • Recent Day Trades
        • BLOGROLL
          • Dividend Growth Blog
          • ETF Sector Blog
          • Dow Dogs
          • TPOW Blog
  • Strategies
        • SWING TRADING
          • Current Positions
          • Watchlists
          • Closed Positions
          • Candidates - TOP 100
          • Specialty Stocks
        • WEEKLY STOCK PICK
          • TPOW Charts
          • TPOW Performance
          • TPOW Strategy Guide
          • TPOW Performance Dashboard
        • DAY TRADING
          • Watch List
        • ATGL DASHBOARD
        • ETF STRATEGIES
          • ETF Sector Rotation
          • ETF Sector Portfolio
        • DIVIDEND GROWTH
          • Dividend Growth Portfolio
          • Dividend Calendar
        • DOGS OF THE DOW
          • Dogs of the Dow Portfolio
          • DOW 5 Portfolio
  • Markets
        • US MARKET
          • Commodities
          • Energy
          • Precious Metals
          • Volatility
        • GLOBAL MARKETS
          • Market Indices
          • Economic Calendar
          • FOREX Heat Map
          • FOREX Cross Rates
          • Crypto Currency Market
  • Investing
    • Discord Community
    • Dashboard
  • Resources
        • ARTICLES
          • Dividend Growth Model Articles
          • ETF Articles
          • Investment Strategies Articles
          • Market and Economic Insights
          • Stock Trade Articles
          • Stock Reviews
        • TOOLS
          • Stock Scanners
          • Charting Software
          • Brokerage Firms
        • STOCK CHARTS
          • Key Components
          • Reading Charts
          • Drawing Stock Charts
          • Identifying Trends
        • RETIREMENT PLANNING
  • About
    • Contact Us
    • How to Win
    • #1 At Stockcharts
    • Disclaimer
    • FAQ
  • Log In
  • Subscribe

August 18, 2020

Money Wave Alert! Aug 18, 2020

DIA Chart
The S&P 500 Index is back on Highs, but not the DOW 30 Index.

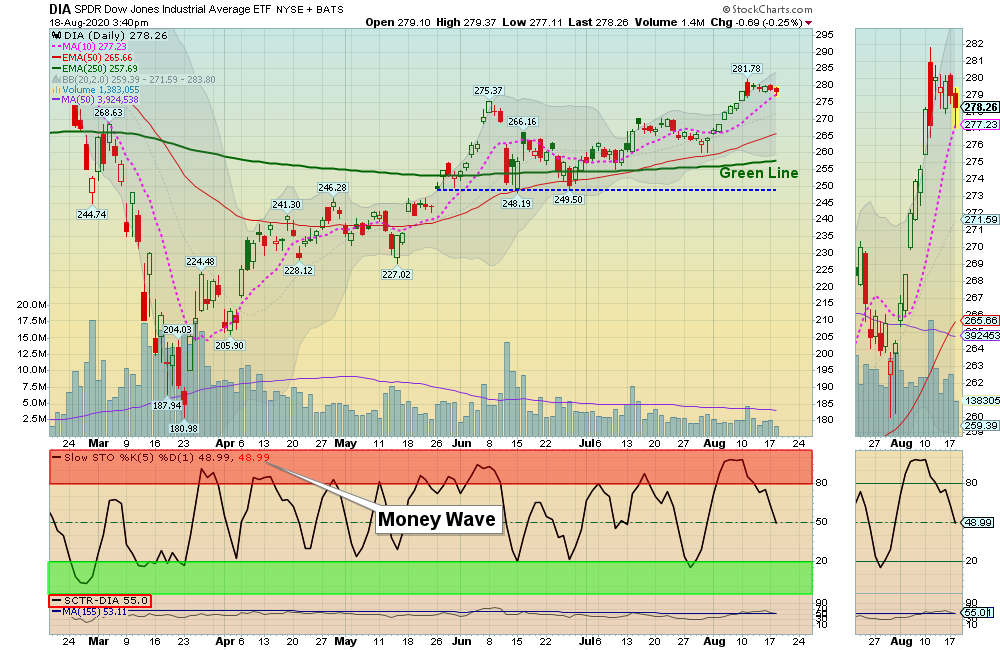
Markets were slightly higher again today as the S&P 500 Index is finally back up to the Feb High on low Volume. Now is the time for all of the Leaders to make Higher Highs. So far there has not been very many New Highs, as much of the Index move is in about 15 Huge Stocks.

Normally the S&P 500 Index will have profit taking up here around the Feb Highs and it needs to stay above the Pink Line (10-day avg.) of 3362, to remain Bullish.

Please WAIT for more Leaders to pop up out of the Green Zones for Money Wave Buy Signals. The better trades happen when the S&P 500 Index is also in the Green Zone. (Now the S&P 500 is back up in the Red Zone).

Please remember that the Markets are up 51% from the March Lows, and are over-bought from “Good News” Buyers. 

Bonds  were up today. 

Crude Oil was down $0.22 today at $42.67.

BUYS TODAY    8/18/2020   

KODK      EASTMAN KODAK CO.     Bought above $11.35 and Stopped Out 5% below today’s High (Filled at $12.32) for 8% Gain.

WKHS      WORKHORSE GROUP INC.      Bought above $15.98 and Stopped Out 5% below today’s High for a 4 % Gain.


VXRT     VAXART INC.       Money Wave Buy today.  VXRT will not be logged as the Volume is below average of 31.9 MIL.  

We will “Not Log” trades if the Reward/Risk is not at least 2:1.   

“JUMP START” Candidates:  (Buy Signal should be very soon… Click on the Jump Start link for more info.)   

MRNA      MODERNA INC.     Buy if it Closes above the Pink Line of $70.84.

____________________________________________________________________________________________________________________________________________________  

WATCH LIST

Money Wave Buys Signals Soon (3 Days-3 Weeks Short Term):   (Best to Buy these when the S&P 500 is also in the Green Zone.)       

The Following Investments will probably have a Money Wave Buy Signal soon. (Slow Stochastic Closing > 20) on today’s Close.   

ABUS      ARBUTUS BIOPHARMA       Buy above $3.97 with 5% Trailing Sell Stop Loss.

IBIO      IBIO INC.     Buy if it Closes above the Pink Line of $3.16.     

PBI      PITNEY BOWES INC.

Please be patient and wait for Money Wave Buy Signals.  We will email you when they are ready. Follow on the WATCH LIST.

Emotions are very high now, so please do not Buy unless you are VERY NIMBLE.

The Leaders are Way Above the Green Lines (all Investments eventually return to their Green Lines).

___________________________________________________________________________________________________

SELLS TODAY   

OPK      OPKO HEALTH INC.       Stopped Out 5% below today’s High at $5.00 for a -2.34 % Loss. 

VBIV      VBI VACCINES INC.        Stopped Out 5% below today’s High at $4.30 for a 11.7 % Gain. 


GDX      GOLD MINERS FUND       EXIT if it is going to Close below $42.76. (3 % off the recent High). This trade was not logged.

ZM      ZOOM VIDEO      Target of $270.00 was Hit for 9.2 % Gain. This trade was not logged.

Click for  CURRENT POSITIONS  and adjust your Sell Stops.   
Click for  CLOSED POSITIONS,   

NEW PENNY STOCK WATCH LIST
ARE YOUR INVESTMENTS ABOVE THE GREEN LINE?
ETF SECTOR ROTATION SYSTEM   
NEW TOP 100 LIST Updated Aug 4, 2020

Many like to Buy the day before, near the Close, if the Money Wave is going to create a Buy Signal (Closing > 20 and out of the Green Zone).

Don’t Buy if the Investment has already popped up too much. Money Wave Buys are usually good for a 3-6 %  move in a few days.

We will “Not Log” trades if the Reward/Risk is not at least 2:1. 

Related Post

– Money Wave Alert! Aug 17, 2020

Subscribe to Our Newsletter

AGL Logo

Get our eBook Now!

Candlestick - A Swing Traders Friend

We don’t spam! Read our privacy policy for more info.

You’ve been successfully subscribed to our newsletter!

Voted #1 at Stock Charts

SH Chart
Inverse S&P 500 Fund (SH) will have a Money Wave Buy today.

Help Us Help Animals

Help Us Help Animals

Recent Comments

  • Market Breadth Indicators: A Trader’s Guide to Early Trend Detection on Backtesting: Definition and How a Trading Strategy Backtest Works
  • Island Reversal Pattern: Definition and Formation Explained on Double Top Pattern: How to Identify and Trade This Reversal Signal
  • Channel Pattern Guide: What It Is and Why It Matters on A Guide to Forecasting Using Moving Averages
  • What Is a Broadening Bottom Chart Pattern? Full Guide on Bull vs. Bear Market: An Investor’s Guide to Market Phases
  • ATGL Weekly Money Flow - 2025-05-11 on ATGL Top Pick of the Week! Apr 6, 2025

Become a Green Liner!

Help me make more Money in the Stock Market.

ON ATGL

  • DashBoard
  • Weekly Commentary
  • Daily Buy / Sell Signals
  • Day Trade Setup
  • Trading Rooms

Design & Develop By Pixelvect

STRATEGIES

  • Swing Trading
  • ATGL Pick of the Week
  • Dividend Growth
  • ETF Sector Rotation
  • Dogs of the Dow

HELP

  • ATGL Trading Rules
  • FAQ
  • Account Maintenance
  • Contact US
  • Join

FOLLOW US

Instagram Linkedin Twitter Facebook

© COPYRIGHT 2024 · ABOVETHEGREENLINE.COM · ALL RIGHTS RESERVED · PRIVACY · TERMS · CONTACT · WATCHLIST · CURRENT