Above the Green Line -01
  • Market Insights
        • Commentary
          • Daily
          • Weekly
        • BUY / SELL SIGNALS
          • Trade Posts
          • Recent Trade Alerts
          • Recent Day Trades
        • BLOGROLL
          • Dividend Growth Blog
          • ETF Sector Blog
          • Dow Dogs
          • TPOW Blog
  • Strategies
        • SWING TRADING
          • Current Positions
          • Watchlists
          • Closed Positions
          • Candidates - TOP 100
          • Specialty Stocks
        • WEEKLY STOCK PICK
          • TPOW Charts
          • TPOW Performance
          • TPOW Strategy Guide
          • TPOW Performance Dashboard
        • DAY TRADING
          • Watch List
        • ATGL DASHBOARD
        • ETF STRATEGIES
          • ETF Sector Rotation
          • ETF Sector Portfolio
        • DIVIDEND GROWTH
          • Dividend Growth Portfolio
          • Dividend Calendar
        • DOGS OF THE DOW
          • Dogs of the Dow Portfolio
          • DOW 5 Portfolio
  • Markets
        • US MARKET
          • Commodities
          • Energy
          • Precious Metals
          • Volatility
        • GLOBAL MARKETS
          • Market Indices
          • Economic Calendar
          • FOREX Heat Map
          • FOREX Cross Rates
          • Crypto Currency Market
  • Investing
    • Discord Community
    • Dashboard
  • Resources
        • ARTICLES
          • Dividend Growth Model Articles
          • ETF Articles
          • Investment Strategies Articles
          • Market and Economic Insights
          • Stock Trade Articles
          • Stock Reviews
        • TOOLS
          • Stock Scanners
          • Charting Software
          • Brokerage Firms
        • STOCK CHARTS
          • Key Components
          • Reading Charts
          • Drawing Stock Charts
          • Identifying Trends
        • RETIREMENT PLANNING
  • About
    • Contact Us
    • How to Win
    • #1 At Stockcharts
    • Disclaimer
    • FAQ
  • Log In
  • Subscribe

August 17, 2021

Money Wave Alert! Aug 17, 2021

XRT Chart
Retail Stocks (XRT) were down today on lower Retail Sales.

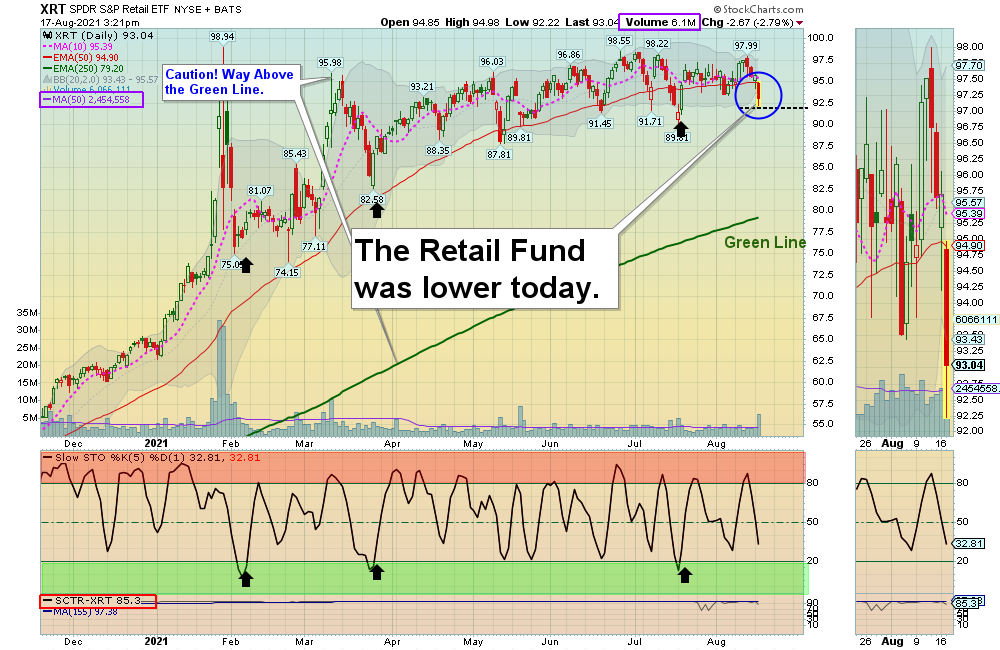
Markets were lower today as the DOW 30 and S&P 500 Indices were very over-bought and were back up in the Red Zones (probably too late to Buy for the Short Term). After today’s decline, the Indices are trying to hold above the Pink Lines (10-day avgs.) to avoid Short Term Sell Signals.

New Investors:  Please be patient and WAIT for a Market pull back. It will happen. Currently the Markets are so extended that the Money Wave Buy Signals are not popping up much. The Low Volume tells us that Smart Money is not participating up here on the Highs. The better trades happen when the S&P 500 Index is also in the Green Zone.  

A few new adds on DAY TRADING SETUPS.

Bonds  were up slightly today, and are Above the Green Line.

Crude Oil was down $0.66 today at $66.71. 

BUYS TODAY    8/17/2021   

MRNA      MODERNA INC.      Money Wave Buy today, but MRNA will not be bought or logged as it is already up 6% today.  Maybe you bought early on the  Jump Start.

We will “Not Log” trades if the Reward/Risk is not at least 2:1, or Low Volume. These have more risk.     

_________________________________________________________________________________________________

JUMP START SCROLLING CHARTS: (Buy Signal should be very soon… Click on the Jump Start link for more info.)        

MRIN      MARIN SOFTWARE      Buy above the Pink Line around $5.66 with High Volume with a 5% Trailing Sell Stop Loss below it.  

____________________________________________________________________________________________________________

WATCH LIST

WATCH LIST SCROLLING CHARTS (Real Time)                   

BTBT      BIT DIGITAL INC.      Wait for Money Wave to Close > 20 with High Volume.       

CHS      CHICO FAS INC.      Wait for Money Wave to Close > 20 with High Volume.       

KKR      KKR & CO. INC.      Money Wave must Close in the Green Zone. (2nd Buy Signal soon).

LEDS      SEMILEDS CORP.   Buy above $10.11 with High Volume with a 5% Trailing Sell Stop Loss below it.   

MMAT      META MATERIALS INC.    Buy above the Green Line of $3.75 with High Volume with a 5% Trailing Sell Stop Loss below it.   

Please be patient and wait for Money Wave Buy Signals.  We will email you when they are ready. Follow on the WATCH LIST.      
Emotions are very high now, so please do not Buy unless you are VERY NIMBLE.

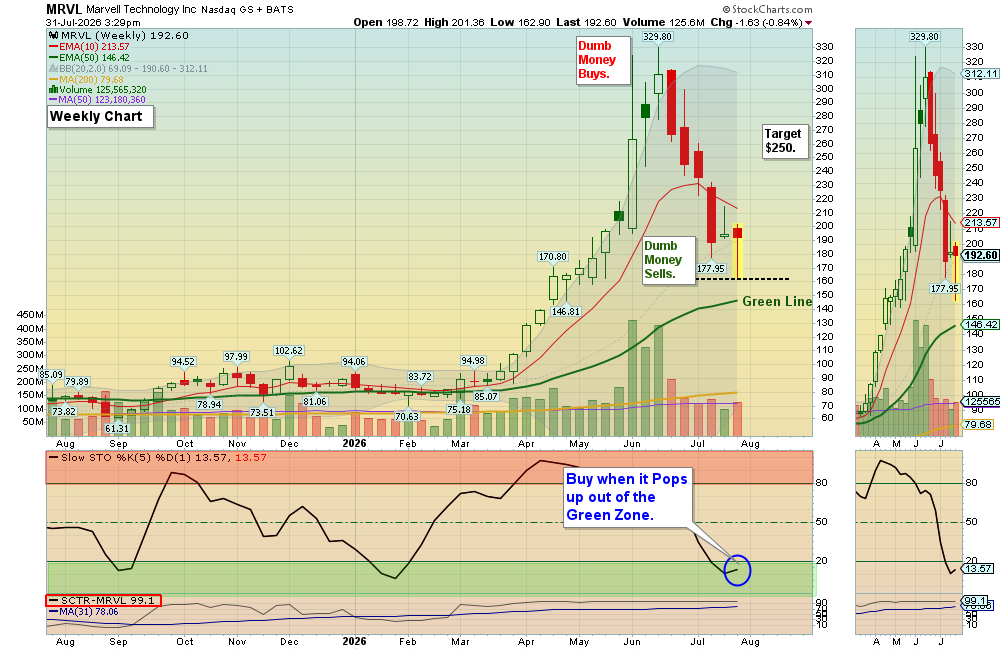
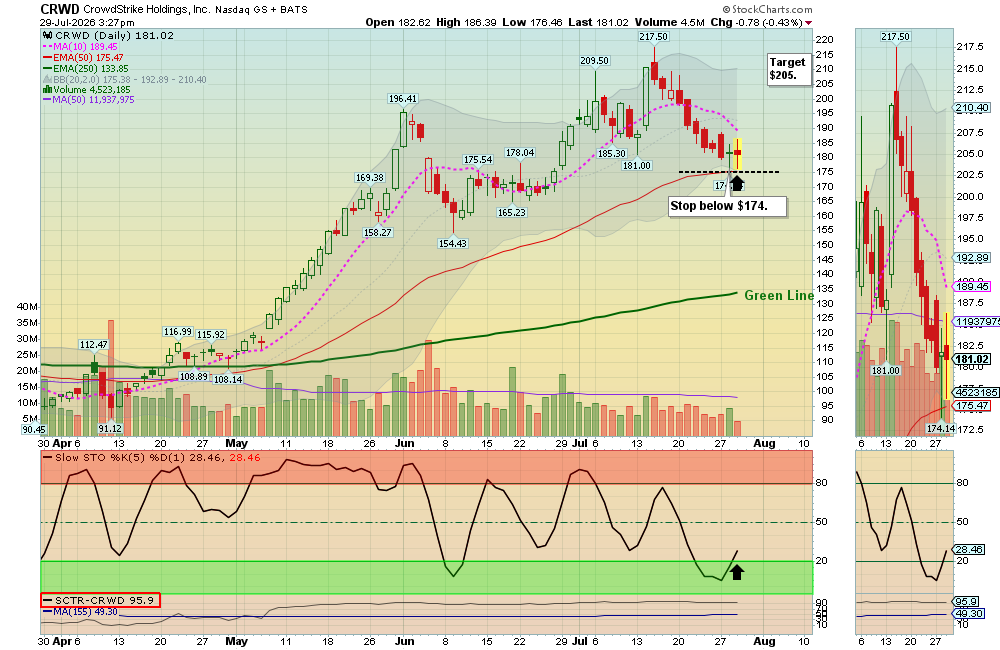
The Leaders are Way Above the Green Lines (all Investments eventually return to their Green Lines).      

____________________________________________________________________________________________________________

SELLS TODAY    

F      FORD MOTOR CO.      LOWER the Sell Stop Loss below $12.79 until it bottoms. F is back down in the Green Zone.

KKR      KKR & CO. INC.      LOWER the Sell Stop Loss below the Red Line of $61.12 until it bottoms.      

Click for  CURRENT POSITION SCROLLING CHARTS – Real Time  (Please check and adjust your Sell Stops).     

Click for  CLOSED POSITIONS,   
NEW:       MY TRADING DASHBOARD
DAY TRADING SETUPS
NEW:  TRADE ALERTS
ARE YOUR INVESTMENTS ABOVE THE GREEN LINE?
ETF SECTOR ROTATION SYSTEM   
TOP 100 LIST Updated Aug 1, 2021

Many like to Buy the day before, near the Close, if the Money Wave is going to create a Buy Signal (Closing > 20 and out of the Green Zone).

Don’t Buy if the Investment has already popped up too much. Money Wave Buys are usually good for a 3-6 %  move in a few days.

We will “Not Log” trades if the Reward/Risk is not at least 2:1, or Low Volume. These have more risk.     

Related Post

– Money Wave Alert! Aug 16, 2021

Subscribe to Our Newsletter

AGL Logo

Get our eBook Now!

Candlestick - A Swing Traders Friend

We don’t spam! Read our privacy policy for more info.

You’ve been successfully subscribed to our newsletter!

Voted #1 at Stock Charts

SH Chart
Inverse S&P 500 Fund (SH) will have a Money Wave Buy today.

Help Us Help Animals

Help Us Help Animals

Recent Comments

  • Market Breadth Indicators: A Trader’s Guide to Early Trend Detection on Backtesting: Definition and How a Trading Strategy Backtest Works
  • Island Reversal Pattern: Definition and Formation Explained on Double Top Pattern: How to Identify and Trade This Reversal Signal
  • Channel Pattern Guide: What It Is and Why It Matters on A Guide to Forecasting Using Moving Averages
  • What Is a Broadening Bottom Chart Pattern? Full Guide on Bull vs. Bear Market: An Investor’s Guide to Market Phases
  • ATGL Weekly Money Flow - 2025-05-11 on ATGL Top Pick of the Week! Apr 6, 2025

Become a Green Liner!

Help me make more Money in the Stock Market.

ON ATGL

  • DashBoard
  • Weekly Commentary
  • Daily Buy / Sell Signals
  • Day Trade Setup
  • Trading Rooms

Design & Develop By Pixelvect

STRATEGIES

  • Swing Trading
  • ATGL Pick of the Week
  • Dividend Growth
  • ETF Sector Rotation
  • Dogs of the Dow

HELP

  • ATGL Trading Rules
  • FAQ
  • Account Maintenance
  • Contact US
  • Join

FOLLOW US

Instagram Linkedin Twitter Facebook

© COPYRIGHT 2024 · ABOVETHEGREENLINE.COM · ALL RIGHTS RESERVED · PRIVACY · TERMS · CONTACT · WATCHLIST · CURRENT