Above the Green Line -01
  • Market Insights
        • Commentary
          • Daily
          • Weekly
        • BUY / SELL SIGNALS
          • Trade Posts
          • Recent Trade Alerts
          • Recent Day Trades
        • BLOGROLL
          • Dividend Growth Blog
          • ETF Sector Blog
          • Dow Dogs
          • TPOW Blog
  • Strategies
        • SWING TRADING
          • Current Positions
          • Watchlists
          • Closed Positions
          • Candidates - TOP 100
          • Specialty Stocks
        • WEEKLY STOCK PICK
          • TPOW Charts
          • TPOW Performance
          • TPOW Strategy Guide
          • TPOW Performance Dashboard
        • DAY TRADING
          • Watch List
        • ATGL DASHBOARD
        • ETF STRATEGIES
          • ETF Sector Rotation
          • ETF Sector Portfolio
        • DIVIDEND GROWTH
          • Dividend Growth Portfolio
          • Dividend Calendar
        • DOGS OF THE DOW
          • Dogs of the Dow Portfolio
          • DOW 5 Portfolio
  • Markets
        • US MARKET
          • Commodities
          • Energy
          • Precious Metals
          • Volatility
        • GLOBAL MARKETS
          • Market Indices
          • Economic Calendar
          • FOREX Heat Map
          • FOREX Cross Rates
          • Crypto Currency Market
  • Investing
    • Discord Community
    • Dashboard
  • Resources
        • ARTICLES
          • Dividend Growth Model Articles
          • ETF Articles
          • Investment Strategies Articles
          • Market and Economic Insights
          • Stock Trade Articles
          • Stock Reviews
        • TOOLS
          • Stock Scanners
          • Charting Software
          • Brokerage Firms
        • STOCK CHARTS
          • Key Components
          • Reading Charts
          • Drawing Stock Charts
          • Identifying Trends
        • RETIREMENT PLANNING
  • About
    • Contact Us
    • How to Win
    • #1 At Stockcharts
    • Disclaimer
    • FAQ
  • Log In
  • Subscribe

April 26, 2017

Money Wave Alert! Apr 26, 2017

TRAN Chart
The Transports are Lagging!


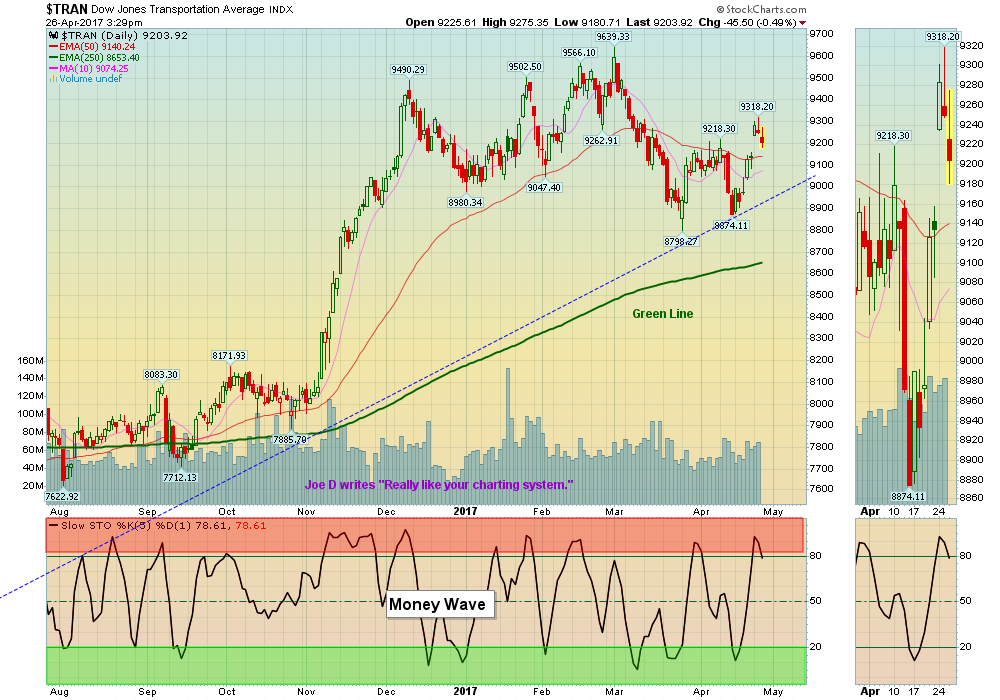
Markets  are up slightly again today on lower Volume, as the Wave 5 up of the Trump Rally is nearing the March Resistance (See Chart Above.) The very Strongest Leaders have bounced back up to the recent Highs, and a few have made New Highs. Very few Investments have Above 90 Relative Strength any more. This is where we find out if the Semis SMH and Financials can make new Highs, or Double Top.

The Reward / Risk  ratio of investing now is poor, so please do not Buy unless you are VERY NIMBLE, as the Leaders are still Way Above the Green Lines.


Money Wave Buys soon!  
The Following Investments will probably have a Money Wave Buy Signal 
(Slow Stochastic Closing > 20) on today’s Close.

BUYS TODAY:   IMMU   IMMUNOMEDICS   Money Wave Buy today. We will not log, as the Markets are Way Above the Green Line.

NRG   NRG ENERGY   Money Wave Buy today. We will not log, as the Markets are Way Above the Green Line.

Please click on the WatchList  to look for  more Money Wave Buy Signals soon. We will email you when they are ready.


SELLS TODAY:   Most Positions are in the Red Zones… If you are uncomfortable holding on near the Highs, then take profits…

EXIT   SYMC   SYMANTEC CORP on the Close, or have a tight Sell Stop Loss, as SYMC is in the Red Zone.

EXIT   X   US STEEL if it is going to Close Below your Buy Price, or $30.51.


Click for  PORTFOLIO  (Open Positions)

Click for  CLOSED POSITIONS

Many like to Buy the day before, near the Close, if the Money Wave is going to create a Buy Signal (Closing > 20).

Don’t Buy if the Investment has already popped up too much. Money Wave Buys are usually good for a 3-6 %  move in a few days.

About 1/3 of the time, the Money Wave Buys will result small losses, so please use a Sell Stop Loss after all Buys.

Related Post

– WatchList

Subscribe to Our Newsletter

AGL Logo

Get our eBook Now!

Candlestick - A Swing Traders Friend

We don’t spam! Read our privacy policy for more info.

You’ve been successfully subscribed to our newsletter!

Voted #1 at Stock Charts

SH Chart
Inverse S&P 500 Fund (SH) will have a Money Wave Buy today.

Help Us Help Animals

Help Us Help Animals

Recent Comments

  • Market Breadth Indicators: A Trader’s Guide to Early Trend Detection on Backtesting: Definition and How a Trading Strategy Backtest Works
  • Island Reversal Pattern: Definition and Formation Explained on Double Top Pattern: How to Identify and Trade This Reversal Signal
  • Channel Pattern Guide: What It Is and Why It Matters on A Guide to Forecasting Using Moving Averages
  • What Is a Broadening Bottom Chart Pattern? Full Guide on Bull vs. Bear Market: An Investor’s Guide to Market Phases
  • ATGL Weekly Money Flow - 2025-05-11 on ATGL Top Pick of the Week! Apr 6, 2025

Become a Green Liner!

Help me make more Money in the Stock Market.

ON ATGL

  • DashBoard
  • Weekly Commentary
  • Daily Buy / Sell Signals
  • Day Trade Setup
  • Trading Rooms

Design & Develop By Pixelvect

STRATEGIES

  • Swing Trading
  • ATGL Pick of the Week
  • Dividend Growth
  • ETF Sector Rotation
  • Dogs of the Dow

HELP

  • ATGL Trading Rules
  • FAQ
  • Account Maintenance
  • Contact US
  • Join

FOLLOW US

Instagram Linkedin Twitter Facebook

© COPYRIGHT 2024 · ABOVETHEGREENLINE.COM · ALL RIGHTS RESERVED · PRIVACY · TERMS · CONTACT · WATCHLIST · CURRENT