Above The Green Line

  • Commentary
    • BUY / SELL SIGNALS
      • Stock Alerts
    • DIVGRO BLOG
    • ETF SECTOR BLOG
    • DOW DOGS BLOG
    • NEWS
    • STOCK IDEAS
  • Strategies
    • SWING TRADING
      • CURRENT POSITIONS
      • WATCHLISTS
      • CLOSED POSITIONS
      • CANDIDATES – TOP 100
      • SPECIALTY STOCKS
    • DAY TRADING
      • Watch List
    • DIVIDEND GROWTH
      • Dividend Growth Portfolio
      • Dividend Calendar
    • DOGS OF THE DOW
      • Dogs of the Dow Portfolio
      • DOW 5 Portfolio
    • ETF SECTOR ROTATION
      • ETF Sector Portfolio
  • Markets
    • US MARKET
      • Commodities
      • Energy
      • Precious Metals
      • Volatility
    • GLOBAL MARKETS
      • MARKET INDICES
      • ECONOMIC CALENDAR
      • FOREX HEAT MAP
      • FOREX CROSS RATES
      • CRYPTOCURRENCY MARKET
    • DASHBOARD
    • IDEAS
  • Investing
    • FORUM
  • Resources
    • ARTICLES
    • WEEKLY STOCK
    • RETIREMENT PLANNING
    • BLOGROLL
    • FAQ
  • About
    • CONTACT US
    • HOW TO WIN
    • #1 AT STOCKCHARTS
  • Log In
  • Subscribe

April 20, 2020

Money Wave Alert! Apr 20, 2020

DIA Chart
The DOW 30 Index is still struggling to get above the 50-day average.

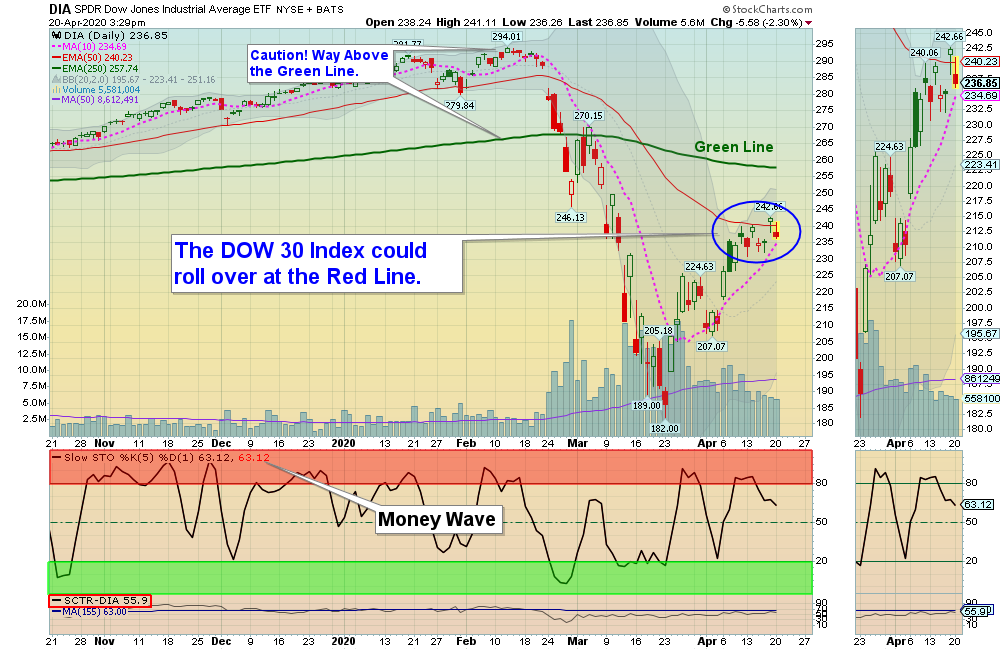
Markets were down today as profit taking came in on some of the Leaders. Most of the Leaders are currently over-bought for the Short Term. The S&P 500 Index should have Support near the Pink Line (10-day avg.) around 2776. All of the major Indices except the NASDAQ 100 are still Below the Green Lines, which is Bearish.

The weaker Indices like the Small Caps, Transports & NYSE could easily go back down once more. This rally from the Lows could be an A-B-C up on Elliott Wave count, and then maybe back down again. Wait for the Leaders to return to their Green Zones (it does not take that long). The Watch List is very small… WAIT.

NEW SUBSCRIBERS: The Green Line System has captured many nice trades from the recent March Lows. Be patient and WAIT for the S&P 500 Index and the Leaders to come back down from the Red Zones and return to the Green Zones for more Money Wave Buys. 


Bonds  were up slightly today.  

Crude Oil was way down today as the May contract expires tomorrow. June was down $3.90 today at $21.14.


The Following Investments will probably have a Money Wave Buy Signal soon. (Slow Stochastic Closing > 20) on today’s Close.

BUYS TODAY    4/20/2020    NONE TODAY 


Money Wave Buys Signals Soon (Short Term):   (Best to Buy these when the S&P 500 is also in the Green Zone.)    


“JUMP START” Candidates:  (Buy Signal should be very soon… Click on the Jump Start link for more info.)   

ATHX      ATHERSYS INC.

UIS     UNISYS CORP.

_______________________________________________________________________________________________________________________________________________

DOG     DOW INVERSE FUND     Buy if it Closes above the Pink Line of $53.97.

VXX     VOLATILITY FUND       Buy if it Closes above $43.72 on High Volume.


Please be patient and wait for Money Wave Buy Signals.  We will email you when they are ready. Click on Watch List.

Emotions are very high now, so please do not Buy unless you are VERY NIMBLE.

The Leaders are Way Above the Green Lines (all Investments eventually return to their Green Lines).

___________________________________________________________________________________________________

SELLS TODAY   


TAL     TAL EDUCATION GROUP     EXIT if it is going to Close Support of $50.15.


Click for   PORTFOLIO  (Open Positions) and adjust your Sell Stops. 

Click for  CLOSED POSITIONS, 

NEW ETF SECTOR ROTATION SYSTEM   (LINK)

NEW! TOP 100 LIST Updated Mar 31, 2020


Many like to Buy the day before, near the Close, if the Money Wave is going to create a Buy Signal (Closing > 20 and out of the Green Zone).

Don’t Buy if the Investment has already popped up too much. Money Wave Buys are usually good for a 3-6 %  move in a few days.

We will “Not Log” trades if the Reward/Risk is not at least 2:1.

Posted By AbovetheGreenLine at 2:42 pm 2 Comments Tagged With: premium

Comments

  1. Jkenjohnson says

    April 20, 2020 at 3:12 pm

    What is place a stop under a swing low mean. And is RWM still on a buy?

    Log in to Reply
    • AbovetheGreenLine says

      April 20, 2020 at 3:22 pm

      The Swing Low is the Support or price where the Investment bounced up last.

      RWM is still a Buy as long as it is above the Swing Low or Support of $43.32.

      RWM Chart

      Log in to Reply

Leave a Reply Cancel reply

You must be logged in to post a comment.

Voted #1 at Stock Charts

SH Chart
Inverse S&P 500 Fund (SH) will have a Money Wave Buy today.

Help Us Help Animals

Help Us Help Animals

Recent Comments

  • psychess on Green Line Weekly Jun 4, 2023
  • AbovetheGreenLine on Money Wave Alert! May 19, 2023
  • Robert Zieman on Money Wave Alert! May 19, 2023
  • Volodymyr Gelfand on Monet Wave Alert! May, 18, 2023
  • Money Wave Alert! May 16, 2023 – InvFuture Education on Money Wave Alert! May 16, 2023

Become a Green Liner!

Help me make more Money in the Stock Market.

Above the Green Line

ON ATGL

  • Weekly Commentary
  • Intraday Buy / Sells
  • Day Trade Setup

STRATEGIES

  • Swing Trading
  • Dividend Growth
  • ETF Sector Rotation
  • Dogs of the Dow

HELP

  • ATGL Trading Rules
  • FAQ
  • Account Maintenance
  • Contact US

© Copyright 2021 · AboveTheGreenLine.com · All Rights Reserved · Privacy · Terms · Contact · WatchList · Current