Above the Green Line -01
  • Market Insights
        • Commentary
          • Daily
          • Weekly
        • BUY / SELL SIGNALS
          • Trade Posts
          • Recent Trade Alerts
          • Recent Day Trades
        • BLOGROLL
          • Dividend Growth Blog
          • ETF Sector Blog
          • Dow Dogs
          • TPOW Blog
  • Strategies
        • SWING TRADING
          • Current Positions
          • Watchlists
          • Closed Positions
          • Candidates - TOP 100
          • Specialty Stocks
        • WEEKLY STOCK PICK
          • TPOW Charts
          • TPOW Performance
          • TPOW Strategy Guide
          • TPOW Performance Dashboard
        • DAY TRADING
          • Watch List
        • ATGL DASHBOARD
        • ETF STRATEGIES
          • ETF Sector Rotation
          • ETF Sector Portfolio
        • DIVIDEND GROWTH
          • Dividend Growth Portfolio
          • Dividend Calendar
        • DOGS OF THE DOW
          • Dogs of the Dow Portfolio
          • DOW 5 Portfolio
  • Markets
        • US MARKET
          • Commodities
          • Energy
          • Precious Metals
          • Volatility
        • GLOBAL MARKETS
          • Market Indices
          • Economic Calendar
          • FOREX Heat Map
          • FOREX Cross Rates
          • Crypto Currency Market
  • Investing
    • Discord Community
    • Dashboard
  • Resources
        • ARTICLES
          • Dividend Growth Model Articles
          • ETF Articles
          • Investment Strategies Articles
          • Market and Economic Insights
          • Stock Trade Articles
          • Stock Reviews
        • TOOLS
          • Stock Scanners
          • Charting Software
          • Brokerage Firms
        • STOCK CHARTS
          • Key Components
          • Reading Charts
          • Drawing Stock Charts
          • Identifying Trends
        • RETIREMENT PLANNING
  • About
    • Contact Us
    • How to Win
    • #1 At Stockcharts
    • Disclaimer
    • FAQ
  • Log In
  • Subscribe

April 12, 2024

Money Wave Alert! Apr 12, 2024

SPX chart
The S&P 500 is finally back down to the 50-day average $SPX.

SWING TRADING (SHORT TERM)
Watchlist and Charts

Watch ListWatch List Charts
Current PositionsCurrent Charts
Closed ResultsTrading Dashboard

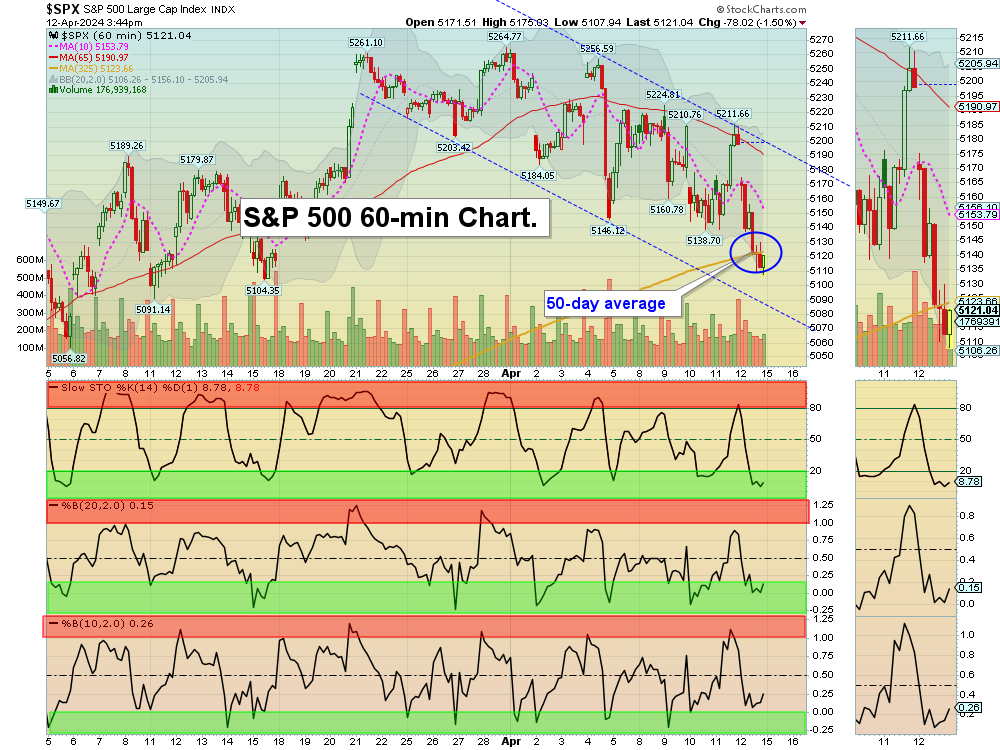
4/12/2024  Markets were sharply lower today on negative News on Earnings and Inflation. The FEAR Index shot up 12 % as the HERD is realizing that there is too much Money in the Economy, from massive Gov’t. borrowing. This means that FED lowering of Rates could be postponed (lowering would fuel more Inflation). We like to Buy on FEAR.

The S&P 500 & NASDAQ 100 need to bounce up off the Red Line (50-day avgs.) to remain Bullish.

Wait for more Buy Signals soon, coming up out of the Green Zones.  CHARTS  The best moves happen when the S&P 500 Index is also coming up out of the Green Zone.  ______________________________________________________________________________

BUYS TODAY   4/12/2024          

BUYS TOMORROW              

GPS      GAP INC.        Wait for Daily Money Wave Close > 20 with High Volume.    

DELL       DELL TECH.       Wait for Daily Money Wave Close > 20 with High Volume.   

Shop for a better price earlier in the day with Triple Buy Signal, on the same day that a Daily Money Wave Buy Signal will occur.  

BUYS SOON                 

CLS      CELESTICA INC.      Wait for Daily Money Wave Close > 20 with High Volume.   

Please be patient and Wait for Money Wave Buy Signals.  We will email you when they are ready. Follow on the WATCH LIST.       

Many like to Buy the Swing Trades just before the Close, if the Money Wave is going to create a Buy Signal (Closing > 20 and up out of the Green Zone). Don’t Buy if the Security has already popped up too much. Money Wave Buy Signals are usually good for a 3-6 % move in a few days.

SELLS TODAY     

CVNA      CARVANA CO.      Lower Sell Stop Loss below the Red Line at $73.36 until it bottoms. It still has 98 Relative Strength.     

CYTK      CYTOKINETICS      EXIT if it is going to Close below the Pink line around  $72.45.

DELL       DELL TECH.      EXIT if it is going to Close below the Pink line around $124.31. Target was Hit at $124 for a 15.3% Gain

HIMS      HIMS & HERS HEALTH      Lower Sell Stop Loss below the Red Line at $13.36 until it bottoms. It still has 98 Relative Strength.     

IBRX      IMMUNITY BIO       Slipped below the Buy Price and was Stopped Out even. The Target was already Hit at $6.25 for a 16.4% Gain.

JMIA      JUMIA TECH        Lower Sell Stop Loss below the Green Line Line at $4.23 until it bottoms.

________________________________________________________________________

DAY TRADING SETUPS.  Today 5 trades for $977.00. Day Trading Alerts are now being sent out on our new Discord Site with Live Chatting. Please install Discord app on your pc or cell for mobile notifications.

Also follow our Trading Room for quick trades. Or look for Triple Buy Pops (3 Green Circles). Big Movers today:  VIXY (+12%) LABD (+11%) & SOXS  (+10%).

Try out the Side by Side layout.       DAY TRADING FOR INDICES & LARGE CAPS CHARTS.

Bonds were up today and are Below the Green Line.  

Crude Oil was up $0.42 today at $85.44.

MY TRADING DASHBOARD 
SWING TRADING CURRENT POSITIONS
DAY TRADING SETUPS
TRADE ALERTS
STAGE CHART INVESTING
GREEN LINE CHARTS AT STOCKCHARTS
ARE YOUR INVESTMENTS ABOVE THE GREEN LINE?
GREEN LINE RULES
ETF SECTOR ROTATION SYSTEM   
New TOP 100 LIST Updated Apr 1, 2024  

* Safer Trades that meet ALL three criteria will be classified as 3 STAR, while trades that only meet two of the three criteria will be flagged as 2 STAR (more risk).       


HAVE A NICE WEEKEND!

Related Post

– GPS

Subscribe to Our Newsletter

AGL Logo

Get our eBook Now!

Candlestick - A Swing Traders Friend

We don’t spam! Read our privacy policy for more info.

You’ve been successfully subscribed to our newsletter!

Voted #1 at Stock Charts

SH Chart
Inverse S&P 500 Fund (SH) will have a Money Wave Buy today.

Help Us Help Animals

Help Us Help Animals

Recent Comments

  • Market Breadth Indicators: A Trader’s Guide to Early Trend Detection on Backtesting: Definition and How a Trading Strategy Backtest Works
  • Island Reversal Pattern: Definition and Formation Explained on Double Top Pattern: How to Identify and Trade This Reversal Signal
  • Channel Pattern Guide: What It Is and Why It Matters on A Guide to Forecasting Using Moving Averages
  • What Is a Broadening Bottom Chart Pattern? Full Guide on Bull vs. Bear Market: An Investor’s Guide to Market Phases
  • ATGL Weekly Money Flow - 2025-05-11 on ATGL Top Pick of the Week! Apr 6, 2025

Become a Green Liner!

Help me make more Money in the Stock Market.

ON ATGL

  • DashBoard
  • Weekly Commentary
  • Daily Buy / Sell Signals
  • Day Trade Setup
  • Trading Rooms

Design & Develop By Pixelvect

STRATEGIES

  • Swing Trading
  • ATGL Pick of the Week
  • Dividend Growth
  • ETF Sector Rotation
  • Dogs of the Dow

HELP

  • ATGL Trading Rules
  • FAQ
  • Account Maintenance
  • Contact US
  • Join

FOLLOW US

Instagram Linkedin Twitter Facebook

© COPYRIGHT 2024 · ABOVETHEGREENLINE.COM · ALL RIGHTS RESERVED · PRIVACY · TERMS · CONTACT · WATCHLIST · CURRENT