08/01/2016 Daily Commentary: Markets continued the sideways move since mid July, as the S&P 500 is trying to hold above the Pink Line (10-day avg.). The Volatility Index is Below $13, which is NOT a good time to expect a Market rally.
The S&P 500 should drop down soon to test Support around 2130. Then it should have another bounce back up to re-test the current Highs. Bonds must make Higher Highs soon, or they will correct.
Gold & Gold Miners bounced off their Red Lines, and MUST make new highs soon to avoid a correction.
Crude Oil is going down to re-test the February Lows… Oil Stocks are not dropping much, telling us Oil could be bottoming soon.
Current Open Positions Most Open Positions are in the Red Zones, so we have set tight Sell Stops. Please check here.
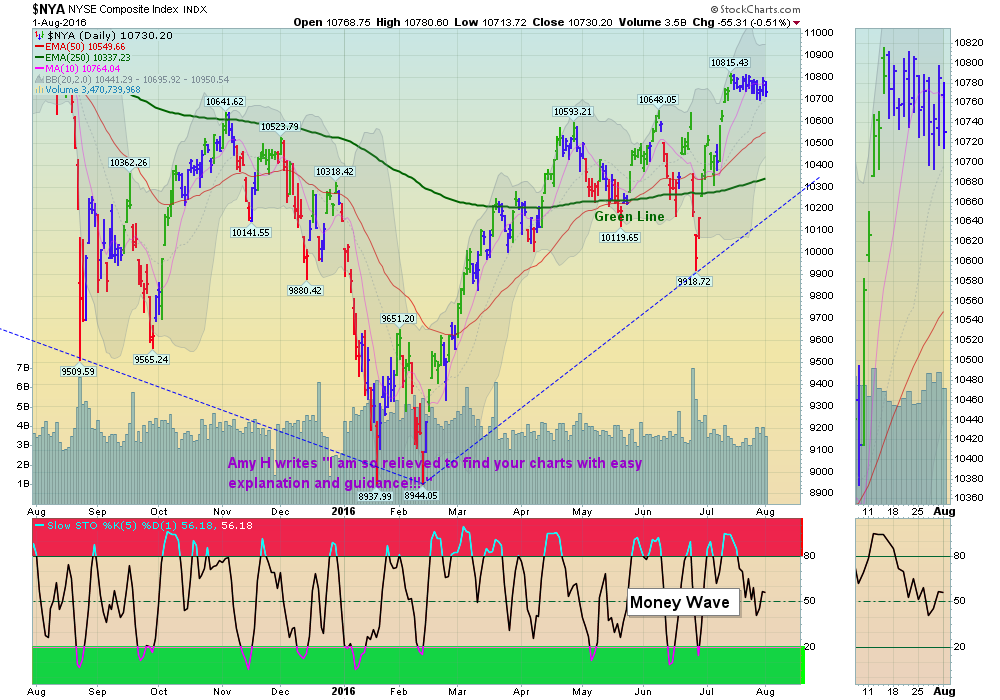
Wait for Money Wave Buys that return to the Green Zones. We will email or text you when they are ready.
Many Funds are having trouble staying Above 90 Relative Strength.
When Markets are tired like they are now, either take quick gains from Money Wave Pops, or STAY IN CASH & WAIT for a larger correction.