
By ATGL
Updated November 24, 2025
Market exhaustion occurs when a prevailing trend—either bullish or bearish—shows signs of losing momentum. Recognizing this transition early is critical for investors and traders aiming to optimize their entry and exit strategies. This article will explore the definition of market exhaustion, common technical signals, and confirmation tools, followed by practical strategies for managing trades near exhaustion points.
What Is Market Exhaustion?
Market exhaustion is a technical condition that suggests a current trend may be approaching its end. It reflects a decrease in the enthusiasm that originally drove the trend, resulting in reduced price movement and participation. For traders and investors, it can act as an early indicator of potential reversals, allowing them to reevaluate exposure and manage risk more effectively.
In an uptrend, market exhaustion often presents as slowing price advances, weaker volume, and divergence in momentum indicators. On the downside, it can show as sellers being unable to push prices significantly lower despite negative sentiment or news. This weakening of force behind the trend often precedes reversals or extended periods of consolidation. Accurately identifying trend exhaustion within a larger market trend is essential for developing strategies that prioritize capital preservation and controlled risk.
Understanding when a market is running out of steam—regardless of direction—helps you make informed trading decisions rather than reacting emotionally.
How To Recognize Exhaustion in the Market
Several technical signs can help identify when a trend is likely reaching exhaustion. Observing them in combination is far more effective than relying on a single signal.
Prolonged Trend with Weakening Price Action
Extended rallies or sell-offs are more likely to end as buying or selling pressure is gradually absorbed. When price increases in an uptrend become smaller, or new lows in a downtrend fail to extend significantly, it reflects diminishing control by the dominant side.
A shift to smaller candlestick bodies and wicks, often seen near major resistance or support zones, may signal hesitation and fatigue. These changes can distort traditional buy signals or sell signals, increasing the likelihood of false signals if confirmation tools are not used.
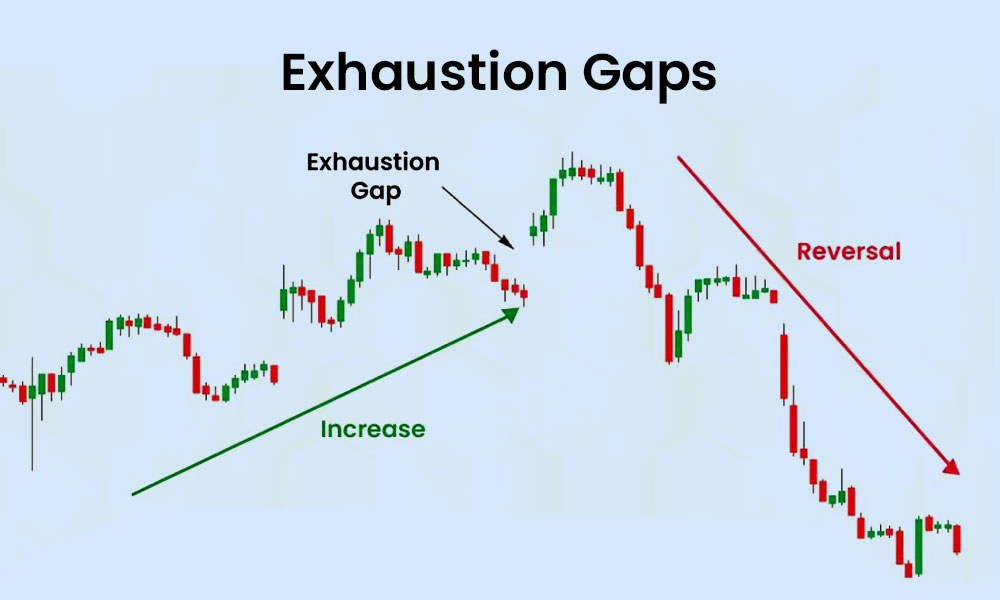
Exhaustion Gaps
An exhaustion gap is a price gap that occurs late in a trend. In a bullish scenario, it may appear as a final upward gap with high volume, followed by declining prices. In a downtrend, the same pattern emerges as a sharp gap down that quickly reverses.
These gaps differ from breakaway or continuation gaps due to their late-stage timing and failure to hold gains or losses. In periods of elevated market volatility, these gaps can be especially misleading, making it essential to combine price action with additional indicators.
Decreasing Participation
A healthy trend typically involves broad market participation. As a trend matures, fewer stocks or sectors support it. This narrowing breadth indicates that the trend is running on limited momentum. Monitoring divergence between the major indices and broader market breadth indicators can help highlight when participation is thinning and trend exhaustion may be near.
Confirmation Tools for Market Exhaustion
While initial signs are important, confirmation through technical indicators is essential to validate potential exhaustion. These tools help filter out noise and improve timing for trade adjustments.
Volume Behavior
Volume often plays a critical role in confirming market exhaustion. In an uptrend, rising prices accompanied by falling volume suggest waning interest. Similarly, in a downtrend, if prices continue to decline but volume does not increase, it may signal that selling pressure is fading.
Detailed insights can be gained through volume analysis and examining the volume profile indicator to assess where accumulation or distribution has occurred. Discrepancies between volume and price movement are often early signs that a trend’s energy is depleted, weakening the reliability of traditional buy signals or sell signals.
MACD Divergence
A widely used confirmation method involves the MACD indicator. When price continues to trend upward while the MACD line forms lower highs, it suggests bearish divergence—indicating a potential trend reversal. The opposite applies in downtrends. Divergences highlight weakening momentum even if price action has yet to confirm the reversal. A failure to acknowledge MACD divergence may result in acting on false signals, especially during high market volatility.
Relative Strength Index (RSI) and Candlestick Patterns
RSI can identify overbought or oversold conditions, but in the context of market exhaustion, divergence between RSI and price movement is particularly valuable. For example, if prices hit a new high but RSI fails to do so, it implies that the upward momentum is no longer supported.
Additionally, candlestick patterns such as doji, hammer, or shooting star formations near key price levels often serve as visual confirmation of exhaustion. These patterns should always be analyzed within broader trend context and with additional supporting data to avoid mistaking temporary pauses for valid buy signals or sell signals.
How To Trade Around Exhaustion Points
Trading around exhaustion levels involves both risk mitigation and strategic opportunity identification. Rather than attempting to time the exact top or bottom, focus on controlling exposure and using signals in confluence.
Entry and Exit Adjustments
Once signs of exhaustion emerge and are confirmed, trimming existing positions or taking partial profits can preserve gains. For those considering reversals, wait for clear breakdowns or breakouts below key moving averages, ideally confirmed by volume spikes or further divergence. This approach reduces the likelihood of entering on false signals and helps refine buy signals in emerging reversals.
Aggressive traders might consider countertrend positions, but only after multiple signals align. Even then, setting conservative profit targets and tight stop-losses is critical due to the higher risk involved, particularly during periods of elevated market volatility.
Risk Management Techniques
Market exhaustion is not an immediate trigger to enter or exit trades. Implementing tight stop-loss orders and scaling out of positions can help manage risk while maintaining some exposure in case the trend continues. A solid understanding of market trend structure allows for better anticipation of exhaustion points. Incorporating structured risk management into your approach allows you to evaluate exhaustion signals in the context of position size, downside thresholds, and overall trend strength.
Mistakes To Avoid When Using Exhaustion Signals
Misinterpreting signals or acting on incomplete data can lead to premature exits or poorly timed entries.
Relying on a Single Indicator
No single technical tool should form the basis of a trading decision. Exhaustion signals, particularly visual ones like candlestick patterns or volume anomalies, require confirmation through momentum indicators or broader market conditions. When a buy signal or sell signal emerges from a single metric, the probability of it being a false signal increases significantly.
Confusing Pullbacks With Exhaustion
Short-term pullbacks are common in healthy trends and do not necessarily indicate exhaustion. A temporary decline in volume or a minor reversal should not be mistaken for a major shift unless accompanied by broader signals. Without contextual analysis of the market trend, traders may exit too early or enter countertrend trades prematurely.
Ignoring Context
A signal observed in isolation, outside of major support/resistance zones or broader market sentiment, often lacks conviction. Always assess exhaustion signals within the framework of larger technical indicators and trend direction. Using tools for identifying trends can prevent false interpretations and clarify whether an observed pattern is genuine or merely noise amplified by market volatility.
Strengthen Your Trading Strategy With Exhaustion Signals
Market exhaustion serves as an early warning system for potential trend reversals, helping you manage entries, exits, and overall exposure with greater precision. Recognizing exhaustion through a combination of price behavior, volume changes, and momentum indicators enables smarter, more disciplined decision-making.
For those ready to refine their trading strategies with professional tools and structured guidance, consider joining our premium program through an Above the Green Line membership.

Related Articles

Margin Call Explained: What Triggers It and How to Avoid One

AMC Short Squeeze Explained: Timeline, Causes, and Trading Risks

Volatility Clustering in Financial Markets: Understand Why It Happens

Chaikin Money Flow (CMF): How to Use Volume to Spot Real Market Strength

[…] buying tops or selling bottoms. For more insight into late-stage moves, exploring concepts like market exhaustion can add valuable […]