Above the Green Line -01
  • Market Insights
        • Commentary
          • Daily
          • Weekly
        • BUY / SELL SIGNALS
          • Trade Posts
          • Recent Trade Alerts
          • Recent Day Trades
        • BLOGROLL
          • Dividend Growth Blog
          • ETF Sector Blog
          • Dow Dogs
          • TPOW Blog
  • Strategies
        • SWING TRADING
          • Current Positions
          • Watchlists
          • Closed Positions
          • Candidates - TOP 100
          • Specialty Stocks
        • WEEKLY STOCK PICK
          • TPOW Charts
          • TPOW Performance
          • TPOW Strategy Guide
          • TPOW Performance Dashboard
          • Why Weekly Trading Works
        • DAY TRADING
          • Watch List
        • ATGL DASHBOARD
        • ETF STRATEGIES
          • ETF Sector Rotation
          • ETF Sector Portfolio
        • DIVIDEND GROWTH
          • Dividend Growth Portfolio
          • Dividend Calendar
        • DOGS OF THE DOW
          • Dogs of the Dow Portfolio
          • DOW 5 Portfolio
  • Markets
        • US MARKET
          • Commodities
          • Energy
          • Precious Metals
          • Volatility
        • GLOBAL MARKETS
          • Market Indices
          • Economic Calendar
          • FOREX Heat Map
          • FOREX Cross Rates
          • Crypto Currency Market
  • Investing
    • Discord Community
    • Dashboard
  • Resources
        • INVESTING GUIDES
          • Dividend Growth Guide
          • Investment Strategy Framework
          • ETF Investing Handbook
          • Stock Trading Handbook
        • ARTICLES
          • Dividend Growth Model Articles
          • ETF Articles
          • Investment Strategies Articles
          • Market and Economic Insights
          • Stock Trade Articles
          • Stock Reviews
        • TOOLS
          • Stock Scanners
          • Charting Software
          • Brokerage Firms
          • Stocks We Review
        • STOCK CHARTS
          • Key Components
          • Reading Charts
          • Drawing Stock Charts
          • Identifying Trends
  • About
    • Contact Us
    • How to Win
    • #1 At Stockcharts
    • Disclaimer
    • FAQ
  • Log In
  • Subscribe

December 5, 2016

Money Wave Buy Alert! Dec 5, 2016

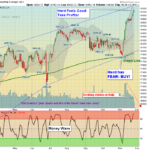
  The Markets are quickly back up near the highs today... Several more Money Wave Buys today, but BE CAREFUL buying on TINY PULL-BACKS. This could be FAKE-OUT. A normal pull-back would take the S&P 500 down near the Red Line (50-day … [Read more...]

December 4, 2016

Weekly Commentary Dec 4, 2016

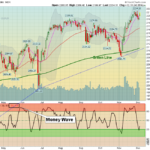
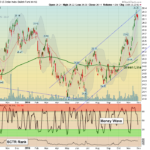
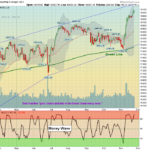
  12/4/2016:  Markets were down slightly for the week, after being extremely over-bought.  The  S&P 500  is back up in the Red Zone on the weekly Chart above, and is also at the Top Bollinger Band from the Trump rally.  Normally a … [Read more...]

December 2, 2016

Money Wave Buy Alert! Dec 2, 2016

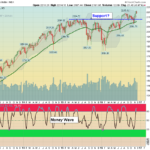
  The Markets are mixed on Friday as the S&P 500 is trying to hold above yesterday's low of 2187. A normal pull-back would take it down near the Red Line (50-day avg.) but it is already back down in the Green Zone. Many Leaders should … [Read more...]

December 1, 2016

Money Wave Buy Alert! Dec 1, 2016

  The Markets are down today (other that the DOW) as the S&P 500 has dropped Below the Pink Line (10-day avg.) to create a short term Sell Signal now weakening. The S&P 500 is back below above the August High of 2194 .The NAZ and … [Read more...]

November 30, 2016

Money Wave Alerts Soon! Nov 30, 2016

  The Markets popped back up to the Highs this morning on higher Oil, but are now weakening. The NAZ and Small Caps are down. The S&P 500 is holding above the August High of 2194 . More Money Wave Buy Signals soon.   Money Wave … [Read more...]

November 29, 2016

Tuesday Nov 29, 2016

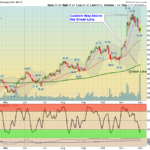
  11/29/2016: The Markets continued to tire out from being extremely over-bought. Usually after a steep up rally like the last 3 weeks, the S&P 500 would correct down near the Pink Line, and go back up to re-test recent Highs. Then if it … [Read more...]

November 28, 2016

Monday Nov 28, 2016

S&P should bounce near the Pink Line (10-day avg.)  11/28/2016:  Markets pulled back today from being extremely over-bought. The S&P 500 should be able to bounce soon around the Pink Line, and go back up to re-test recent Highs. Next … [Read more...]

November 26, 2016

Weekly Commentary Nov 26, 2016

  11/26/2016:  To find a good Investment opportunity, you need to look for FEAR! Last month before the Election, the Herd was scared of what might happen. Since then the DOW has bounced off the Green Line and rallied 1268 points. Now the FEAR … [Read more...]

November 25, 2016

Money Wave Alert! Nov 25, 2016

WE will Lower Sell Stop on EWZ and keep.   Happy Thanksgiving! The Markets are stretching Way Above the Green Lines on low Holiday Volume. The S&P 500 is above the August High of 2194 (now 2210). Be careful here because of the Low … [Read more...]

November 23, 2016

Wednesday Nov 23, 2016

DOW is now stretched after Bouncing off Green Line.   11/23/2016:  Markets were up again today, as Trump Honeymoon Rally continued. Caution! Tammy is feeling great, and panic Buying... three weeks ago she was Selling on FEAR, at the Green … [Read more...]

  • « Previous Page
  • 1
  • …
  • 539
  • 540
  • 541
  • 542
  • 543
  • …
  • 559
  • Next Page »

Subscribe to Our Newsletter

AGL Logo

Get our eBook Now!

Candlestick - A Swing Traders Friend

We don’t spam! Read our privacy policy for more info.

You’ve been successfully subscribed to our newsletter!

Voted #1 at Stock Charts

SH Chart
Inverse S&P 500 Fund (SH) will have a Money Wave Buy today.

Help Us Help Animals

Help Us Help Animals

Recent Comments

  • ATGL Weekly Money Flow - 2026-02-08 on ATGL Top Pick of the Week! Jan 25, 2026
  • ATGL Weekly Money Flow - 2026-01-25 on ATGL Top Pick of the Week! Jan 11, 2026
  • ATGL Weekly Money Flow - 2025-12-28 on ATGL Top Pick of the Week Dec 21, 2025
  • Inside Bar Trading Strategy: Improve Timing and Wins on Price Action Trading: Mastering the Art of Reading the Market Without Indicators
  • Breakaway Gap Explained: Identify High-Probability Setups on Identifying Market Exhaustion Signals for Smarter Trading Decisions

Become a Green Liner!

Help me make more Money in the Stock Market.

ON ATGL

  • DashBoard
  • Weekly Commentary
  • Daily Buy / Sell Signals
  • Day Trade Setup
  • Trading Rooms

Design & Develop By Pixelvect

STRATEGIES

  • Swing Trading
  • ATGL Pick of the Week
  • Dividend Growth
  • ETF Sector Rotation
  • Dogs of the Dow

HELP

  • ATGL Trading Rules
  • FAQ
  • Account Maintenance
  • Contact US
  • Join

FOLLOW US

Instagram Linkedin Twitter Facebook

© COPYRIGHT 2024 · ABOVETHEGREENLINE.COM · ALL RIGHTS RESERVED · PRIVACY · TERMS · CONTACT · WATCHLIST · CURRENT