Above the Green Line -01
  • Market Insights
        • Commentary
          • Daily
          • Weekly
        • BUY / SELL SIGNALS
          • Trade Posts
          • Recent Trade Alerts
          • Recent Day Trades
        • BLOGROLL
          • Dividend Growth Blog
          • ETF Sector Blog
          • Dow Dogs
          • TPOW Blog
  • Strategies
        • SWING TRADING
          • Current Positions
          • Watchlists
          • Closed Positions
          • Candidates - TOP 100
          • Specialty Stocks
        • WEEKLY STOCK PICK
          • TPOW Charts
          • TPOW Performance
          • TPOW Strategy Guide
          • TPOW Performance Dashboard
          • Why Weekly Trading Works
        • DAY TRADING
          • Watch List
        • ATGL DASHBOARD
        • ETF STRATEGIES
          • ETF Sector Rotation
          • ETF Sector Portfolio
        • DIVIDEND GROWTH
          • Dividend Growth Portfolio
          • Dividend Calendar
        • DOGS OF THE DOW
          • Dogs of the Dow Portfolio
          • DOW 5 Portfolio
  • Markets
        • US MARKET
          • Commodities
          • Energy
          • Precious Metals
          • Volatility
        • GLOBAL MARKETS
          • Market Indices
          • Economic Calendar
          • FOREX Heat Map
          • FOREX Cross Rates
          • Crypto Currency Market
  • Investing
    • Discord Community
    • Dashboard
  • Resources
        • INVESTING GUIDES
          • Dividend Growth Guide
          • Investment Strategy Framework
          • ETF Investing Handbook
          • Stock Trading Handbook
        • ARTICLES
          • Dividend Growth Model Articles
          • ETF Articles
          • Investment Strategies Articles
          • Market and Economic Insights
          • Stock Trade Articles
          • Stock Reviews
        • TOOLS
          • Stock Scanners
          • Charting Software
          • Brokerage Firms
          • Stocks We Review
        • STOCK CHARTS
          • Key Components
          • Reading Charts
          • Drawing Stock Charts
          • Identifying Trends
  • About
    • Contact Us
    • How to Win
    • #1 At Stockcharts
    • Disclaimer
    • FAQ
  • Log In
  • Subscribe

May 10, 2017

Money Wave Alert! May 10, 2017

MU Chart

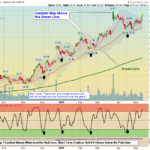
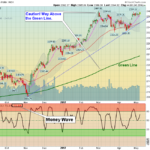
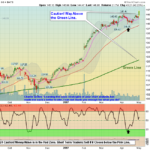
Micron is back up near the Highs!  Markets  are at total Equilibrium (same amount of Buyers & Sellers) at the March Highs  (Resistance).  The S&P 500 is still barely holding Above the Pink Line (10-day avg.) to avoid a Short Term Sell … [Read more...]

May 9, 2017

Money Wave Alert! May 9, 2017

QQQ Chart

  Markets  still cannot decide to push up thru Resistance, or Fail today. The S&P 500 is still barely holding Above the Pink Line (10-day avg.) to avoid a Short Term Sell Signal.  The DOW, NYSE & Transport Indices have still not made … [Read more...]

May 8, 2017

Money Wave Alert! May 8, 2017

DOW Chart

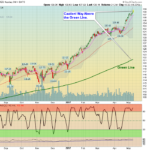
  Markets  cannot decide to push up thru Resistance, or Fail today. The S&P 500 is still holding Above the Pink Line (10-day avg.) to avoid a Short Term Sell Signal.  The DOW, NYSE & Transport Indices have still not made it back up to … [Read more...]

May 7, 2017

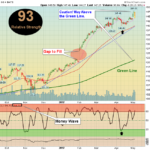
Weekly Commentary May 7, 2017

GOOGL Chart

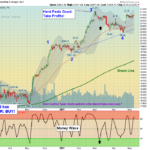
  05/07/2017:  Markets were up for the week, as the Indices are finally re-testing the March Highs. The NASDAQ 100, Techs & World Indices have gotten stronger, while the DOW, Financials, Transports, Metals & Commodities have all … [Read more...]

May 5, 2017

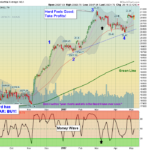
Money Wave Alert! May 5, 2017

SPX Chart

  Markets  are up slightly today, as Crude Oil has recovered a little. The S&P 500 is still holding Above the Pink Line (10-day avg.) to avoid a Short Term Sell Signal (see Chart above).  The S&P, DOW, NYSE & Transport Indices … [Read more...]

May 4, 2017

Money Wave Alert! May 4, 2017

DOW Chart

  Markets  are still mixed today, even with the House passing a new Heath Care Act. The S&P 500 is barely holding Above the Pink Line (10-day avg.), and should burp up soon.  The S&P, DOW, NYSE & Transport Indices have still not … [Read more...]

May 3, 2017

Money Wave Alert! May 3, 2017

AAPL Chart

  Markets  are mixed again today, as the S&P 500 dipped down to the Pink Line (10-day avg.), and should burp up soon.  The S&P, DOW, NYSE & Transport Indices have still not made it back up to the March Highs.   Try to unload … [Read more...]

May 2, 2017

Money Wave Alert! May 2, 2017

SPX Chart

  Markets  are mixed today, and the S&P 500 is going sideways at the March Highs (see Chart Above). Maybe another burp up soon. AAPL Earnings are today after the Close.   Try to unload investments that you own that are struggling (not … [Read more...]

May 1, 2017

Money Wave Alert! May 1, 2017

AAPL Chart

  Markets  are up slightly today, and the Big NAZDAQ Darlings like  AMZN GOOGL NFLX & MSFT are pushing higher on AAPL Earnings on Tuesday.  Try to unload investments that you own that are struggling (not making New Highs), so you will … [Read more...]

April 30, 2017

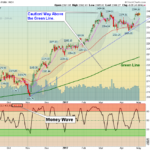
Weekly Commentary Apr 30, 2017

NYSE Chart

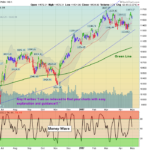
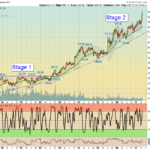
The New York Index is Struggling back up to the March Highs. 04/30/2017:  Markets were up for the week, as the Strongest Leaders made New Highs.  The weaker Indices (Dow, NYSE Financials & Transports) have not made it back up to the March … [Read more...]

  • « Previous Page
  • 1
  • …
  • 526
  • 527
  • 528
  • 529
  • 530
  • …
  • 559
  • Next Page »

Subscribe to Our Newsletter

AGL Logo

Get our eBook Now!

Candlestick - A Swing Traders Friend

We don’t spam! Read our privacy policy for more info.

You’ve been successfully subscribed to our newsletter!

Voted #1 at Stock Charts

SH Chart
Inverse S&P 500 Fund (SH) will have a Money Wave Buy today.

Help Us Help Animals

Help Us Help Animals

Recent Comments

  • ATGL Weekly Money Flow - 2026-02-08 on ATGL Top Pick of the Week! Jan 25, 2026
  • ATGL Weekly Money Flow - 2026-01-25 on ATGL Top Pick of the Week! Jan 11, 2026
  • ATGL Weekly Money Flow - 2025-12-28 on ATGL Top Pick of the Week Dec 21, 2025
  • Inside Bar Trading Strategy: Improve Timing and Wins on Price Action Trading: Mastering the Art of Reading the Market Without Indicators
  • Breakaway Gap Explained: Identify High-Probability Setups on Identifying Market Exhaustion Signals for Smarter Trading Decisions

Become a Green Liner!

Help me make more Money in the Stock Market.

ON ATGL

  • DashBoard
  • Weekly Commentary
  • Daily Buy / Sell Signals
  • Day Trade Setup
  • Trading Rooms

Design & Develop By Pixelvect

STRATEGIES

  • Swing Trading
  • ATGL Pick of the Week
  • Dividend Growth
  • ETF Sector Rotation
  • Dogs of the Dow

HELP

  • ATGL Trading Rules
  • FAQ
  • Account Maintenance
  • Contact US
  • Join

FOLLOW US

Instagram Linkedin Twitter Facebook

© COPYRIGHT 2024 · ABOVETHEGREENLINE.COM · ALL RIGHTS RESERVED · PRIVACY · TERMS · CONTACT · WATCHLIST · CURRENT