Above the Green Line -01
  • Market Insights
        • Commentary
          • Daily
          • Weekly
        • BUY / SELL SIGNALS
          • Trade Posts
          • Recent Trade Alerts
          • Recent Day Trades
        • BLOGROLL
          • Dividend Growth Blog
          • ETF Sector Blog
          • Dow Dogs
          • TPOW Blog
  • Strategies
        • SWING TRADING
          • Current Positions
          • Watchlists
          • Closed Positions
          • Candidates - TOP 100
          • Specialty Stocks
        • WEEKLY STOCK PICK
          • TPOW Charts
          • TPOW Performance
          • TPOW Strategy Guide
          • TPOW Performance Dashboard
          • Why Weekly Trading Works
        • DAY TRADING
          • Watch List
        • ATGL DASHBOARD
        • ETF STRATEGIES
          • ETF Sector Rotation
          • ETF Sector Portfolio
        • DIVIDEND GROWTH
          • Dividend Growth Portfolio
          • Dividend Calendar
        • DOGS OF THE DOW
          • Dogs of the Dow Portfolio
          • DOW 5 Portfolio
  • Markets
        • US MARKET
          • Commodities
          • Energy
          • Precious Metals
          • Volatility
        • GLOBAL MARKETS
          • Market Indices
          • Economic Calendar
          • FOREX Heat Map
          • FOREX Cross Rates
          • Crypto Currency Market
  • Investing
    • Discord Community
    • Dashboard
  • Resources
        • INVESTING GUIDES
          • Dividend Growth Guide
          • Investment Strategy Framework
          • ETF Investing Handbook
          • Stock Trading Handbook
        • ARTICLES
          • Dividend Growth Model Articles
          • ETF Articles
          • Investment Strategies Articles
          • Market and Economic Insights
          • Stock Trade Articles
          • Stock Reviews
        • TOOLS
          • Stock Scanners
          • Charting Software
          • Brokerage Firms
          • Stocks We Review
        • STOCK CHARTS
          • Key Components
          • Reading Charts
          • Drawing Stock Charts
          • Identifying Trends
  • About
    • Contact Us
    • How to Win
    • #1 At Stockcharts
    • Disclaimer
    • FAQ
  • Log In
  • Subscribe

August 25, 2017

Money Wave Alert! Aug 25, 2017

DIA Chart

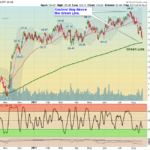
  Markets are up today, but the Buying is not good. There were many Money Wave Buys this week, but few decent Pops. Markets have no story and the Leaders are High, so not much action. The Leading DOW Index, and the Tech Fund must make … [Read more...]

August 24, 2017

Money Wave Alert! Aug 24, 2017

  Markets are down slightly again today, but not much selling so far. The Leading DOW Index, and the Tech Fund have stalled at the Pink Lines (10-day avgs.) and need to break above those to return to the Highs. The weaker Investments that … [Read more...]

August 23, 2017

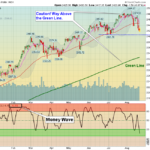
Money Wave Alert! Aug 23, 2017

SPX Chart

  Markets are down slightly today, after yesterday's "Gapped Up". The Leading DOW Index, and the Tech Fund have stalled at the Pink Lines (10-day avgs.) and need to break above those to return to the Highs. The weaker Investments that fell … [Read more...]

August 22, 2017

Money Wave Alert! Aug 22, 2017

XLK Chart

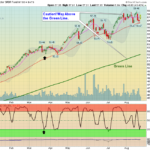
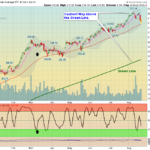
  Markets "Gapped Up" today, as the Leading DOW Index, and the Tech Fund bounced up off their Red Lines (50-day avgs.) The weaker Investments that fell below their Red Lines are not doing as well. The S&P 500 is trying to Close above … [Read more...]

August 21, 2017

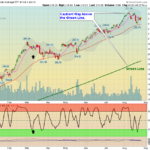
Money Wave Alert! Aug 21, 2017

SPX Chart

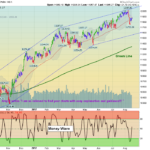
  Markets were down in the morning, then weak Buying came in. The weaker Indices are still below the Red Lines (50-day avgs.) for some Medium Term Sell Signals. The S&P 500 fell below the previous Support at 2437, so next Support is … [Read more...]

August 20, 2017

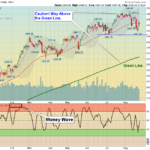
Green Line Weekly Aug 20, 2017

IWM Chart

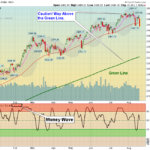
  08/20/2017:  Markets were down again this week. The Money Wave Pops were poor, indicating that not many Buyers were left with the Markets near Highs. Now the Small Caps have corrected down near the Green Line, for a probably bounce … [Read more...]

August 18, 2017

Money Wave Alert! Aug 18, 2017

DIA Chart

  Markets are mixed today, after the weaker Indices slipped below the Red Lines (50-day avgs.) yesterday for some Medium Term Sell Signals. The S&P 500 fell below the previous Support at 2437, so next Support is around 2408. Try to Buy … [Read more...]

August 17, 2017

Money Wave Alert! Aug 17, 2017

SPX Chart

  Markets are down today, filling the "GAP UP" from panic Buying last week. The Buying was poor recently, so nimble Traders got out. The S&P 500 has Support at 2437, for possible "W" pattern back up. Markets must make New Highs soon … [Read more...]

August 16, 2017

Money Wave Alert! Aug 16, 2017

NYA Chart

  Markets are trying to push higher, but the Buying is poor. There have been many Money Wave Buy Signals this week, but the bounces are weak so far. The Markets could be exhausted after good Earnings  recently. Markets must make New Highs … [Read more...]

August 15, 2017

Money Wave Alert! Aug 15, 2017

GE Chart

  Markets don't have any news, so little movement today. More Money Wave Buy Signals are kicking in today, but the bounces are poor so far. Markets must make New Highs soon for this rally to continue. AAPL is one of the few New Highs … [Read more...]

  • « Previous Page
  • 1
  • …
  • 517
  • 518
  • 519
  • 520
  • 521
  • …
  • 559
  • Next Page »

Subscribe to Our Newsletter

AGL Logo

Get our eBook Now!

Candlestick - A Swing Traders Friend

We don’t spam! Read our privacy policy for more info.

You’ve been successfully subscribed to our newsletter!

Voted #1 at Stock Charts

SH Chart
Inverse S&P 500 Fund (SH) will have a Money Wave Buy today.

Help Us Help Animals

Help Us Help Animals

Recent Comments

  • ATGL Weekly Money Flow - 2026-02-08 on ATGL Top Pick of the Week! Jan 25, 2026
  • ATGL Weekly Money Flow - 2026-01-25 on ATGL Top Pick of the Week! Jan 11, 2026
  • ATGL Weekly Money Flow - 2025-12-28 on ATGL Top Pick of the Week Dec 21, 2025
  • Inside Bar Trading Strategy: Improve Timing and Wins on Price Action Trading: Mastering the Art of Reading the Market Without Indicators
  • Breakaway Gap Explained: Identify High-Probability Setups on Identifying Market Exhaustion Signals for Smarter Trading Decisions

Become a Green Liner!

Help me make more Money in the Stock Market.

ON ATGL

  • DashBoard
  • Weekly Commentary
  • Daily Buy / Sell Signals
  • Day Trade Setup
  • Trading Rooms

Design & Develop By Pixelvect

STRATEGIES

  • Swing Trading
  • ATGL Pick of the Week
  • Dividend Growth
  • ETF Sector Rotation
  • Dogs of the Dow

HELP

  • ATGL Trading Rules
  • FAQ
  • Account Maintenance
  • Contact US
  • Join

FOLLOW US

Instagram Linkedin Twitter Facebook

© COPYRIGHT 2024 · ABOVETHEGREENLINE.COM · ALL RIGHTS RESERVED · PRIVACY · TERMS · CONTACT · WATCHLIST · CURRENT