Above the Green Line -01
  • Market Insights
        • Commentary
          • Daily
          • Weekly
        • BUY / SELL SIGNALS
          • Trade Posts
          • Recent Trade Alerts
          • Recent Day Trades
        • BLOGROLL
          • Dividend Growth Blog
          • ETF Sector Blog
          • Dow Dogs
          • TPOW Blog
  • Strategies
        • SWING TRADING
          • Current Positions
          • Watchlists
          • Closed Positions
          • Candidates - TOP 100
          • Specialty Stocks
        • WEEKLY STOCK PICK
          • TPOW Charts
          • TPOW Performance
          • TPOW Strategy Guide
          • TPOW Performance Dashboard
          • Why Weekly Trading Works
        • DAY TRADING
          • Watch List
        • ATGL DASHBOARD
        • ETF STRATEGIES
          • ETF Sector Rotation
          • ETF Sector Portfolio
        • DIVIDEND GROWTH
          • Dividend Growth Portfolio
          • Dividend Calendar
        • DOGS OF THE DOW
          • Dogs of the Dow Portfolio
          • DOW 5 Portfolio
  • Markets
        • US MARKET
          • Commodities
          • Energy
          • Precious Metals
          • Volatility
        • GLOBAL MARKETS
          • Market Indices
          • Economic Calendar
          • FOREX Heat Map
          • FOREX Cross Rates
          • Crypto Currency Market
  • Investing
    • Discord Community
    • Dashboard
  • Resources
        • INVESTING GUIDES
          • Dividend Growth Guide
          • Investment Strategy Framework
          • ETF Investing Handbook
          • Stock Trading Handbook
        • ARTICLES
          • Dividend Growth Model Articles
          • ETF Articles
          • Investment Strategies Articles
          • Market and Economic Insights
          • Stock Trade Articles
          • Stock Reviews
        • TOOLS
          • Stock Scanners
          • Charting Software
          • Brokerage Firms
          • Stocks We Review
        • STOCK CHARTS
          • Key Components
          • Reading Charts
          • Drawing Stock Charts
          • Identifying Trends
  • About
    • Contact Us
    • How to Win
    • #1 At Stockcharts
    • Disclaimer
    • FAQ
  • Log In
  • Subscribe

October 25, 2017

Money Wave Alert! Oct 25, 2017

/spx Chart

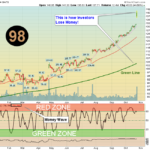
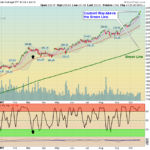
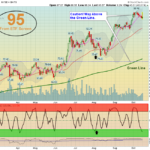
  Markets are lower today on profit taking.  The S&P 500 slipped Below the Pink Line (10-day avg.) this morning. Now it is trying to Close above 2561 to avoid a Short Term Sell Signal.  Most of the Leaders are in the Red Zones … [Read more...]

October 24, 2017

Money Wave Alert! Oct 24, 2017

CAT Chart

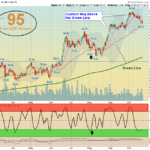
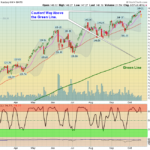
  Markets are re-testing Friday's Highs today.  The DOW Index is up more today as Caterpillar and MMM both "Gapped Up" on good Earnings today  The Strongest Indices are holding above the the Pink Lines (10-day avgs.) to avoid Short Term Sell … [Read more...]

October 23, 2017

Money Wave Alert! Oct 23, 2017

XBI Chart

  Markets are mixed today after Friday's rally. The Strongest Indices are holding above the the Pink Lines (10-day avgs.) to avoid Short Term Sell Signals. The BioTechs are in the Green Zone, but no Buy Signal yet. Most of the Leaders are … [Read more...]

October 22, 2017

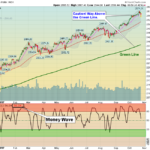
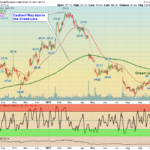
Green Line Weekly Oct 22, 2017

TNX Chart

  10/22/2017:  Markets squirted higher for the week, as Investors piled in on the Good News of better than expected Earnings and Tax Cut hopes. Historically with an improving Economy, Interest Rates and Inflation would rise. This month, … [Read more...]

October 20, 2017

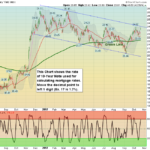
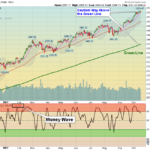
Money Wave Alert! Oct 20, 2017

DIA Chart

  Markets continue to "Melt Up" on Good News and panic Buying. The Strongest Indices bounced up off the Pink Lines yesterday (10-day avgs.) and made Higher Highs today. The BioTechs are still weak, but are in the Green Zone. Most of the … [Read more...]

October 19, 2017

Money Wave Alert! Oct 19, 2017

QQQ Chart

  Markets "Gapped Down" this morning, but were able to recover after bouncing up off the Pink Lines (10-day avgs.) to avoid Short Term Sell Signals. The BioTechs are still weak, but in the Green Zone. Most of the Leaders are in the Red … [Read more...]

October 18, 2017

Money Wave Alert! Oct 18, 2017

IBM Chart

  Markets "Gapped Up" today on panic buying of IBM and other DOW Stocks. The NASDAQ is mixed, and the S&P is only up 0.17% today. Not many Investments are making New Highs (like the Indices are). Most Indices are holding above the Pink … [Read more...]

October 17, 2017

Money Wave Alert! Oct 17, 2017

SPX Chart

  Markets are up slightly again today, but not many Investments are making New Highs (like the Indices are). Most Indices are holding above the Pink Lines (10-day avgs.) to avoid Short Term Sell Signals. Most of the Leaders are in the Red … [Read more...]

October 16, 2017

Money Wave Alert! Oct 16, 2017

XBI Chart

  Still no Sellers as the Semiconductors squirted higher. Markets are up slightly again today, and are holding above the Pink Lines (10-day avgs.) to avoid Short Term Sell Signals. The BioTech Fund went higher early today on a possible … [Read more...]

October 15, 2017

Green Line Weekly Oct 15, 2017

SPX Weekly Chart

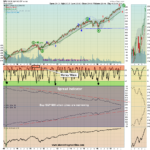
    10/15/2017:  Markets were higher for the week, as there are not many other places to put your money, yet. Historically with an improving Economy, Interest Rates and Inflation would rise. This would normally make Bonds and … [Read more...]

  • « Previous Page
  • 1
  • …
  • 512
  • 513
  • 514
  • 515
  • 516
  • …
  • 559
  • Next Page »

Subscribe to Our Newsletter

AGL Logo

Get our eBook Now!

Candlestick - A Swing Traders Friend

We don’t spam! Read our privacy policy for more info.

You’ve been successfully subscribed to our newsletter!

Voted #1 at Stock Charts

SH Chart
Inverse S&P 500 Fund (SH) will have a Money Wave Buy today.

Help Us Help Animals

Help Us Help Animals

Recent Comments

  • ATGL Weekly Money Flow - 2026-02-08 on ATGL Top Pick of the Week! Jan 25, 2026
  • ATGL Weekly Money Flow - 2026-01-25 on ATGL Top Pick of the Week! Jan 11, 2026
  • ATGL Weekly Money Flow - 2025-12-28 on ATGL Top Pick of the Week Dec 21, 2025
  • Inside Bar Trading Strategy: Improve Timing and Wins on Price Action Trading: Mastering the Art of Reading the Market Without Indicators
  • Breakaway Gap Explained: Identify High-Probability Setups on Identifying Market Exhaustion Signals for Smarter Trading Decisions

Become a Green Liner!

Help me make more Money in the Stock Market.

ON ATGL

  • DashBoard
  • Weekly Commentary
  • Daily Buy / Sell Signals
  • Day Trade Setup
  • Trading Rooms

Design & Develop By Pixelvect

STRATEGIES

  • Swing Trading
  • ATGL Pick of the Week
  • Dividend Growth
  • ETF Sector Rotation
  • Dogs of the Dow

HELP

  • ATGL Trading Rules
  • FAQ
  • Account Maintenance
  • Contact US
  • Join

FOLLOW US

Instagram Linkedin Twitter Facebook

© COPYRIGHT 2024 · ABOVETHEGREENLINE.COM · ALL RIGHTS RESERVED · PRIVACY · TERMS · CONTACT · WATCHLIST · CURRENT