
10/15/2017: Markets were higher for the week, as there are not many other places to put your money, yet. Historically with an improving Economy, Interest Rates and Inflation would rise. This would normally make Bonds and Commodities more competitive with Stocks. So far that has not happened, and most Stock and ETF Investments are over-bought.
Most Funds are back up in the Red Zones, so Nimble traders should be raising Cash. Consumer Confidence is at a 13 year high, so the Herd feels great. We like to Buy when the Herd is SCARED, and Investments are ON SALE!
Crude Oil was up 4.4% for the week, and GOLD was up 2.3%.
___________________________________________________________________________________________
MONEY WAVE BUYS SOON: We is currently in 1 logged Open Positions, for the Short Term. There are 4 Investments on the Short Term Watch List, so be patient and WAIT for Green Zone Buys!
______________________________________________________________________________________________
LONG TERM TRADES
The Funds below are currently out of favor, but historically these could possibly Double or more from these lower levels. We are looking for a good Entry Point for these, but need the entire Economy & Inflation to pick up speed:
TWITTER TWTR is Basing, and will be added to the Long Term List to Buy soon.
BITA BITA HOLDINGS Wait for Green Zone on the Weekly Chart.
DBC COMMODITY FUND Waiting for Break Out Above $16.08.
JJC COPPER FUND Volume is Super Low.
KOL COAL FUND Relative Strength is back Below 90.
LL LUMBER LIQUIDATORS Wait for Green Zone on Weekly Chart.
REMX RARE EARTH FUND Wait for Green Zone on Weekly Chart.
UGA US GASOLINE FUND Waiting on Break Out Above $32.03.
VALE VALE DE RIO Relative Strength is back Below 90.
___________________________________________________________________________________________
Click for Portfolio (Open Positions)
Click for Watch List
Click for Closed Positions
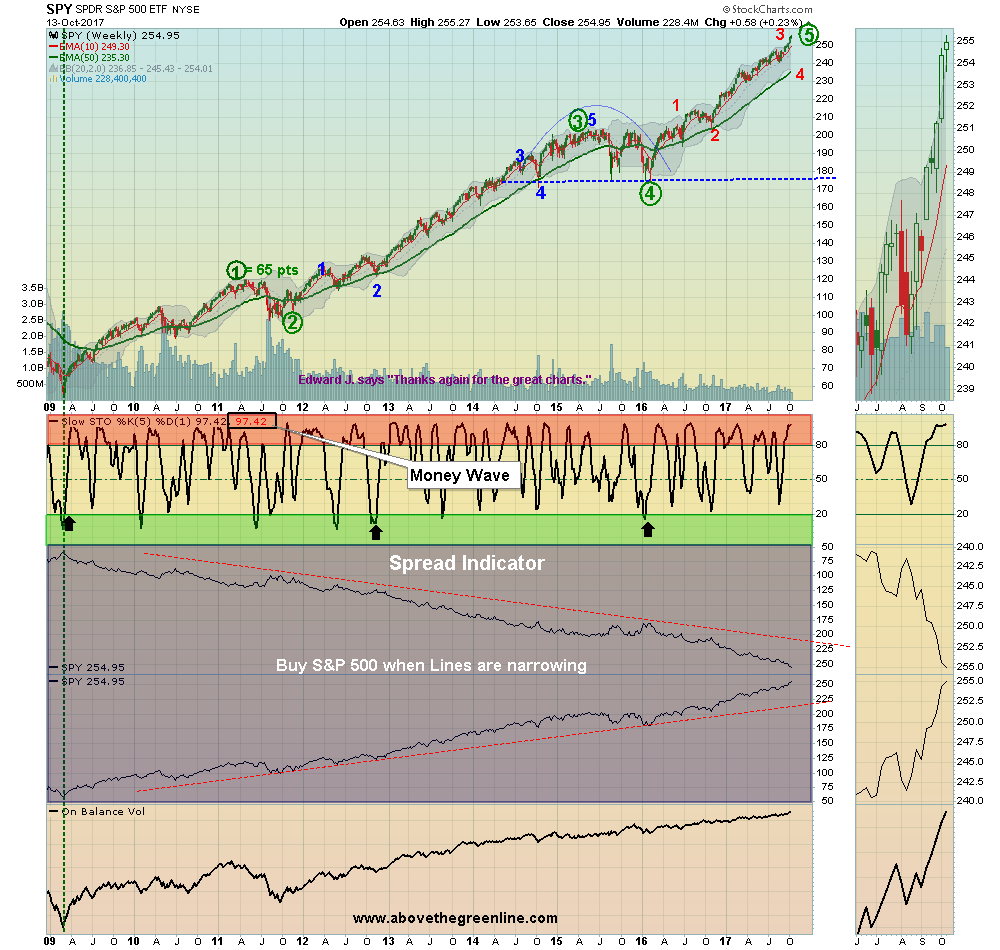
Alert! Market Risk is HIGH (Red Zone). The probability of successful Short Term Trades is lower, when the S&P 500 is Way Above the Green Line. Even the Strongest Funds can get chopped up. Either take quick gains from Money Wave Pops, or STAY IN CASH & WAIT for a larger correction.
[s_static_display]
Tell your Friends about the Green Line, and Help Animals.
A Letter to Sarah:
Hi Sarah. Above the Green Line is a System of rotating into Investments that generally have more Buyers than Sellers (Above the Green Line > 250 day average), and the highest Relative Strength (> 90 RS).
This System is designed to Buy High, and Sell Higher, Momentum Investing that requires the discipline to EXIT Investment position that are no longer the LEADERS, or follow the RULES.
Many are taught to Buy Low and Sell High, which can work well, but sometimes you must wait years for results.
We are basically using computers to identify the top 10% of Investments that have the highest flow of money into them. Then we Buy these on pull-backs to their Green Zones, based on the Money Wave.
Good trading, and tell your friends!


